All products featured are independently chosen by us. However, SoundGuys may receive a commission on orders placed through its retail links. See our ethics statement.
What is MDAQS? The Multi-Dimensional Audio Quality Score explained
Published onOctober 23, 2024

As SoundGuys enters its 10th year, we continue to build and enhance our sound quality assessment toolkit with the addition of something very special. We are excited to announce that in collaboration with the audio test and measurement experts at HEAD acoustics GmbH, we’re bringing Multi-Dimensional Audio Quality Scores (MDAQS) to our product reviews. This represents a huge step forward for us.
In this article, we will break down MDAQS, how we measure it, how it was developed, and how it will make our reviews more useful to everyone!
Editor’s note: this article was updated on October 23, 2024, to clarify language and fix typographical errors.
- MDAQS is a cutting-edge audio playback assessment technique encompassing advanced research into the human perception of sound quality.
- It simplifies the characterization of audio systems by producing three mean opinion scores plus an overall quality rating.
- It can be applied to almost any acoustic playback system, including headphones, earbuds, speakers, and soundbars.
- You can find these scores at the top of any review, and in sections discussing sound quality.
The evaluation of audio quality is a tricky subject. Spend any time online in audio forums, and you’ll likely witness endless discussions about the validity and usefulness of typical audio measurements compared to the importance of our individual listening experience. This is what’s known as the objective vs subjective debate.

The only way to define and quantify the performance characteristics of audio gear is with proper measurements. But human perception undoubtedly plays a decisive role in assessing the performance of audio systems, so we need to incorporate subjective impressions into our assessments somehow. Finding appropriate metrics that correlate the listener’s experience of sound quality with things that can be objectively measured has been the goal of researchers in this field for many decades.
Controlled listening tests can capture details of an individual’s perception but are slow and cumbersome to run on large cohorts of listeners, which is necessary for the data to be useful. Technical measurements, like frequency response and harmonic distortion, are helpful but need interpretation and contextual explanation for the general public. And, while frequency response is one of the most critical indicators of sound quality, it only tells us part of the story and doesn’t account for listener preferences.
What is MDAQS?
MDAQS provides a novel approach to assessing audio quality and is built on listening tests, advanced analysis, and machine learning.

The Multi-Dimensional Audio Quality Score (MDAQS) from HEAD acoustics is a software tool that produces consistent, repeatable audio quality assessment results — based on human perception — in a scientific and quantifiable way. It’s an instrumental evaluation system that analyzes binaural recordings, mimicing human hearing and all the acoustic paths involved. This system has numerous benefits over existing approaches: it models the sound quality perception of real listeners, reduces the need for expert interpretation of measurement data, and presents numerical results in a format that anyone can grasp.
Thanks to extensive research efforts by HEAD acoustics, MDAQS outputs simple metrics that describe the overall audio quality on a scale from 1.0 (very bad) to 5.0 (very good). It calculates mean opinion scores (MOS) for perception-independent quality dimensions of audio playback quality and then condenses them into an overall score. It’s a bit like the SPF number on sunscreen bottles: a single number representing more complex factors.
The MDAQS algorithm’s complex analysis produces three mean opinion scores plus an overall quality rating:
- Timbre (MOS-T): How faithfully is the frequency spectrum reproduced, and how precise is the temporal resolution?
- Distortion (MOS-D): Is the playback unimpaired by adverse influences, or how “clean” is the sound signal?
- Immersiveness (MOS-I): How well are virtual sound sources defined in three-dimensional space? The concept of “immersiveness” had previously been characterized in research using different words like soundstage, stereo image, spatial impression, and acoustic image — see this document from the International Telecommunication Union (ITU) for more details.
- Overall (MOS-O) Combines the above three values into a weighted overall quality score to allow for quick and easy comparison of overall audio quality.
These parameters provide a reliable, meaningful assessment of audio quality that’s directly comparable across product types. This gives us a general approach for characterizing headphones, IEMs, loudspeakers, soundbars, and almost any acoustic playback system. Using this system, time-consuming and cost-intensive listening tests with human subjects are no longer as necessary for product developers or, arguably, for product reviews (where extensive controlled listening tests have always been prohibitively expensive).
How does MDAQS work?
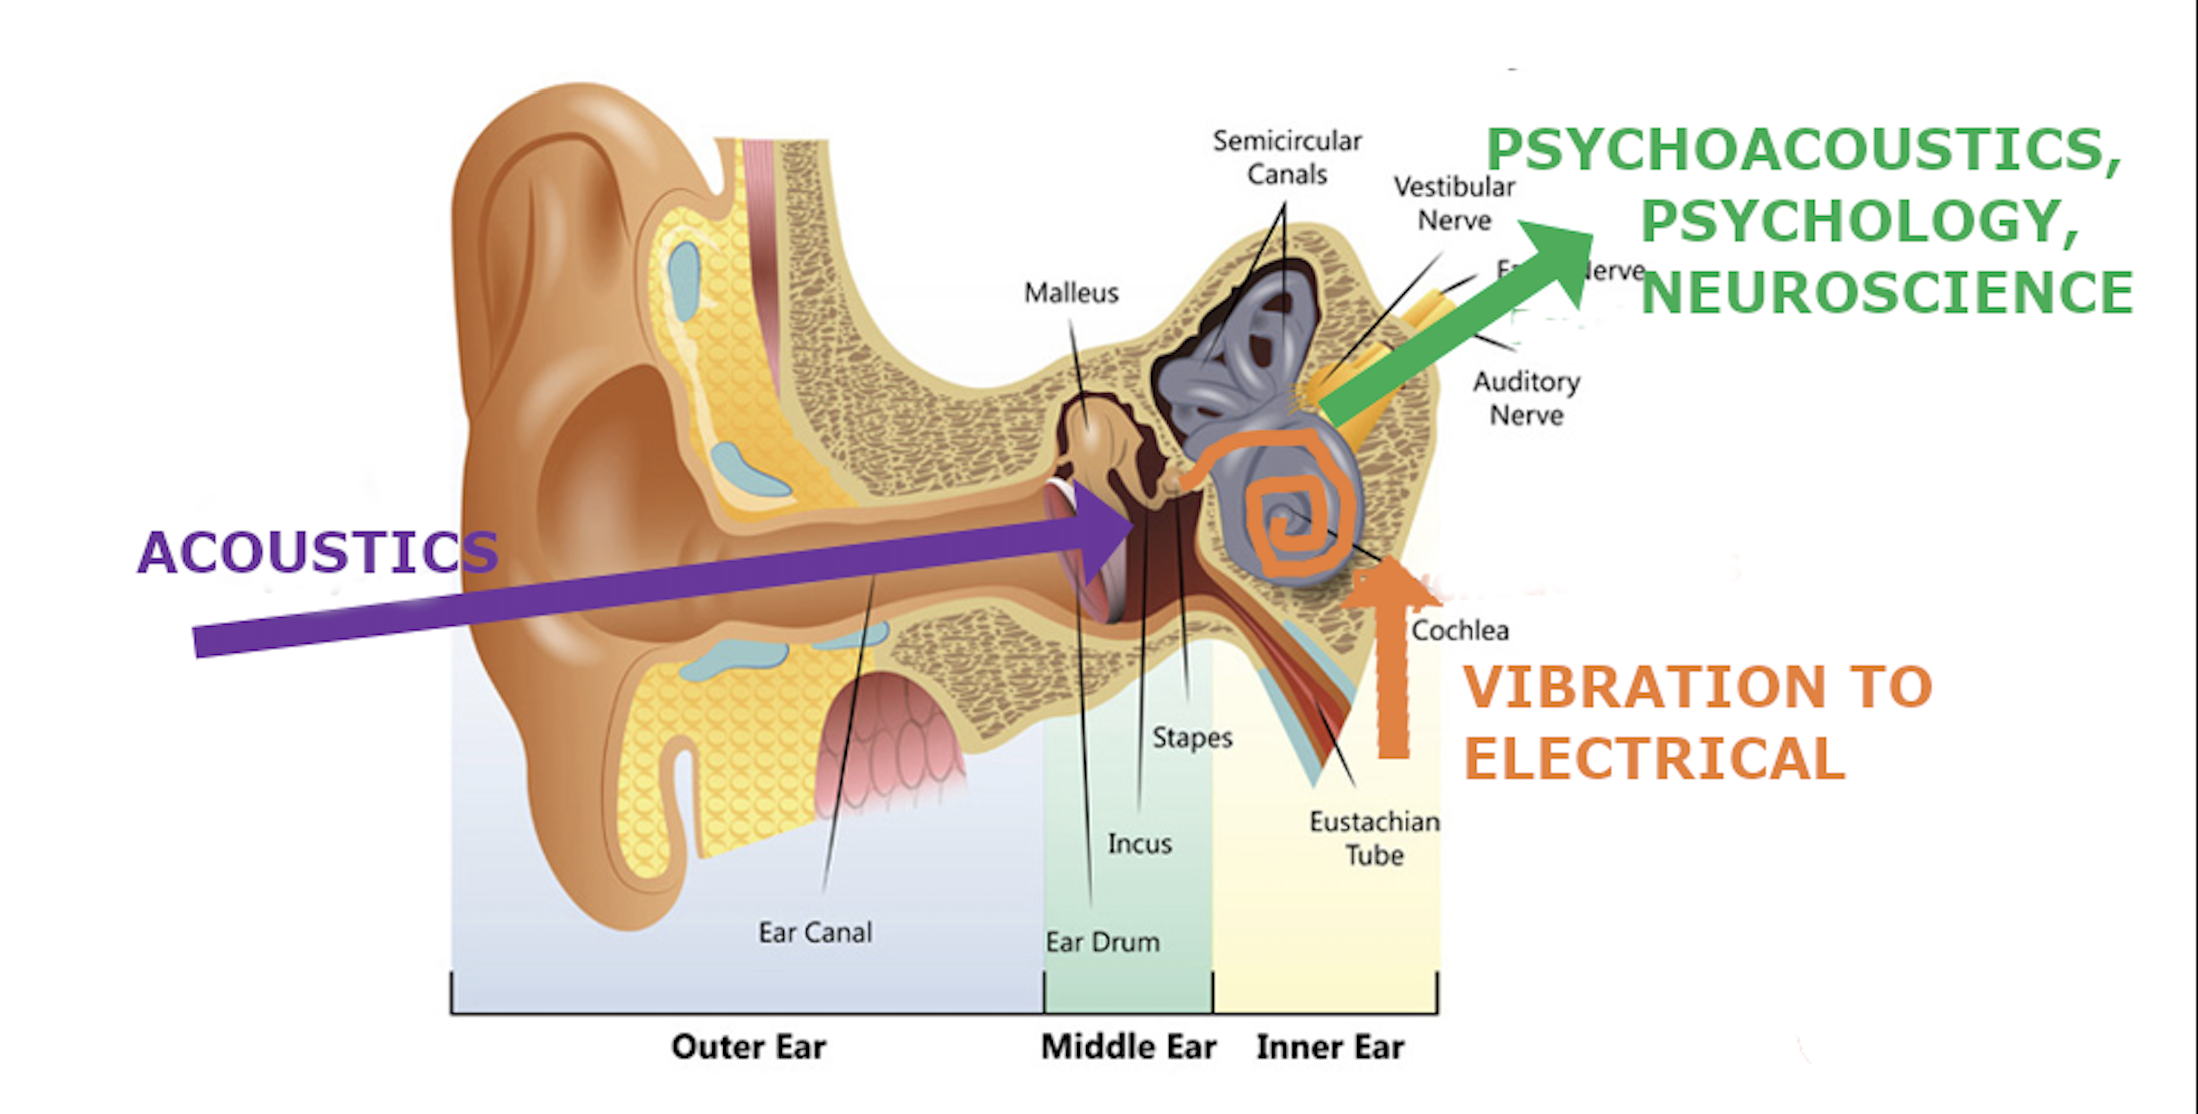
Ideally, an instrumental audio quality assessment system should replicate human test subjects’ perceptions. MDAQS does this by analyzing binaural recordings of a specific stimulus file played back through the device under test (DUT). This file consists of uncompressed, high-resolution stereo audio recordings of six styles of music and test signals (sine sweeps) that must be captured from the playback device using a realistic acoustic test head. The captured binaural recordings include all the playback device’s characteristics required for evaluation, incorporating actual auditory pathways to best approximate real listeners.

The analysis stage involves applying human perception models to the binaural recordings. The process is pretty processor-intensive and involves two main steps: pre-processing and analysis. Pre-processing incorporates binaural hearing and signal processing in our ears and brains. This model considers timing and amplitude differences, providing a correlation matrix between signals from both ears that mimics human spatial perception.
For the analyses of the timbre, distortions, and immersiveness attributes, the most crucial metric is the target frequency response, derived from the preferred frequency response of the listeners in the jury tests. Weighting factors are introduced based on the content of the music. MDAQS calculates numerical results based on the mean opinion score (MOS) ranking system (from ITU recommendation ITU-T P.800). Result values are not limited to integers and may have one decimal digit (e.g., 3.2).
Timbre (MOS-T) represents the playback system’s spectral properties and temporal resolution. The timbre analysis considers the following:
1. The frequency response of the DUT is compared to a target frequency response derived from the listening tests. The metric calculates a quality value from the comparison.
2. Spectral flux, described as the DUT’s reproduction of the signal‘s temporal structure.
3. Comparison between source signals and recorded signals of essential frequency bands for the listener to evaluate the audio quality of the DUT, specifically bass (50 Hz – 250 Hz) and upper midrange (2 kHz – 4 kHz).
4. HEAD acoustics’ hearing model is used for many attributes of the human hearing system.
Distortion (MOS-D) represents non-linearities and added noise. The distortion analysis considers the following:
1. Delta in frequency response: The frequency response of the DUT is compared to a target frequency response derived from the auditory assessment.
2. Harmonic distortion.
3. Analysis of the spectrogram of the sweep signals (looks for non-linearities).
4. Modulation spectra.
Immersiveness (MOS-I) represents perceived source width and virtual source position. The immersiveness analysis considers the following:
1. Delta in frequency response: The frequency response of the DUT is compared to a target frequency response derived from the auditory assessment. A quality value is calculated from the comparison.
2. Spectral flux indicates the reproduction of the signal‘s temporal structure. This is important for spatial perception of the audio signal.
3. Comparison of spectral content in the upper mid-range frequency band is most significant.
4. Binaural hearing model: Two variants of differences between correlograms. The model quantifies the spatial perception of a human listener.
How do you measure MDAQS?

To measure MDAQS, you need three things:
- The MDAQS “stimulus” file.
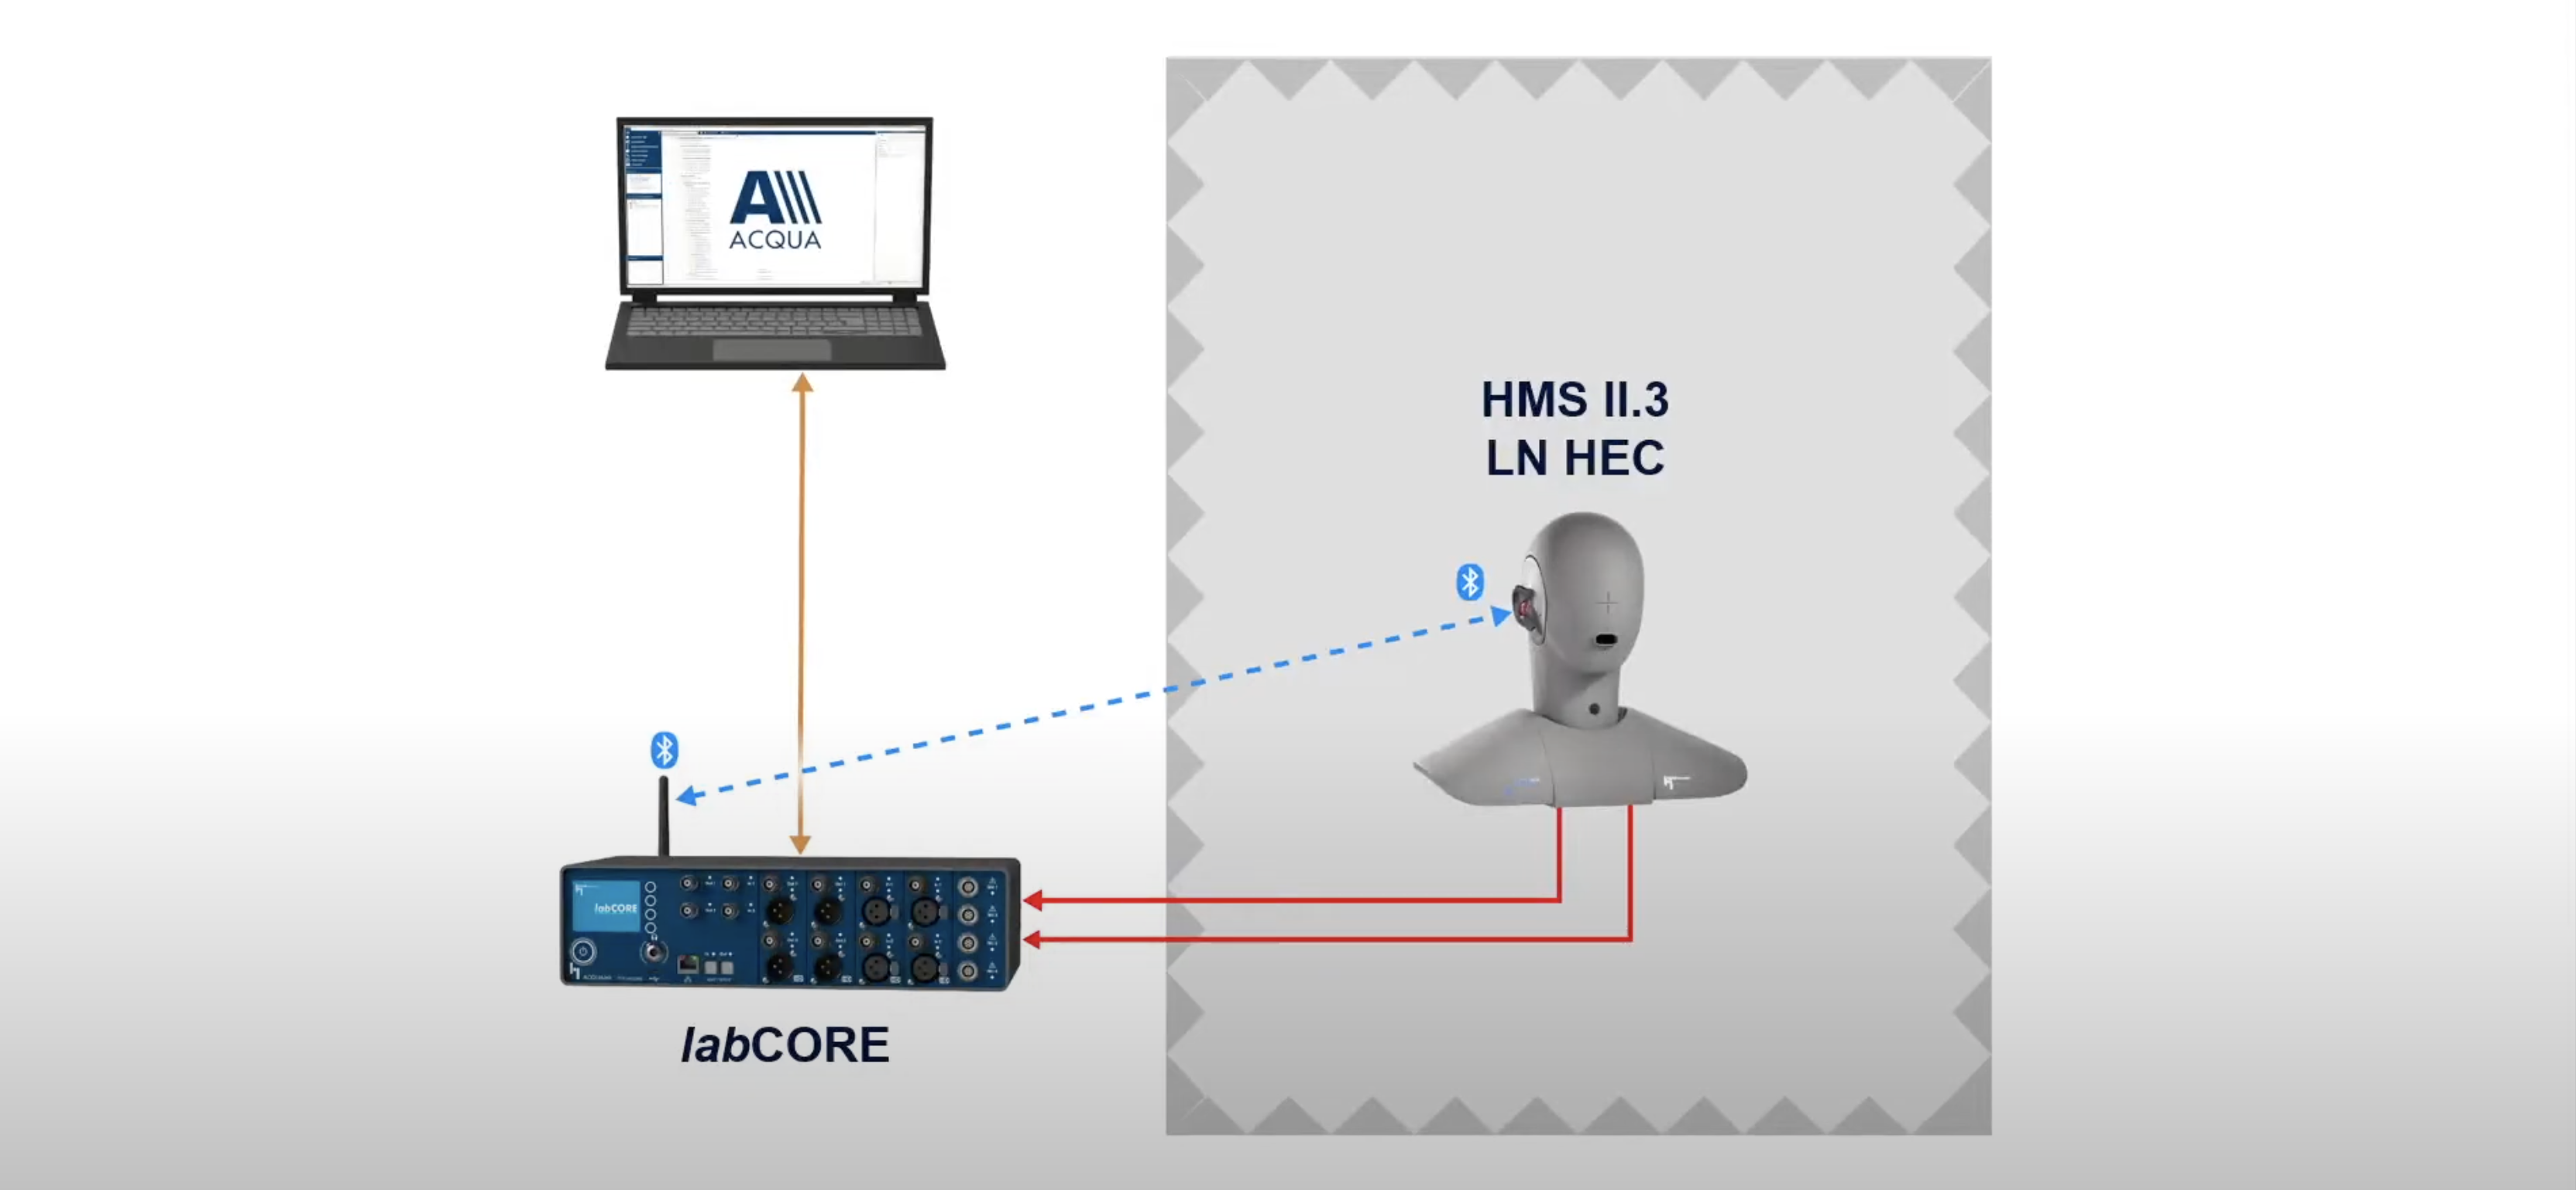
- A calibrated acoustic test head (designed according to ITU P.58) with anatomically shaped ears and ear canals (compliant with ITU-T P.57 4.3 or 4.4 ears) that’s capable of binaural capture with ancillary equipment for high-quality digital recording, like a HEAD acoustics labCORE system.
- The Head Acoustics MDAQS module (running under ACQUA) on a capable host PC.
The test head must have correct, anatomically shaped concha and ear canals, allowing for the most realistic and accurate headphone placement, especially for in-ear devices. Getting a proper seal and fit for larger circumaural (over-ear) headphones is also essential. Placement of the DUT — whether it’s earbuds, headphones, speakers, or some wearable device — takes time and consideration. Positioning for the measurement needs to be representative of real-life usage and the left and right channels aligned as closely as possible. Once confirmed by measuring and comparing frequency responses for both channels, the stimulus file is played over the DUT. The playback level is representative of the typical usage of the product in a quiet space without unwanted background noises or disturbances. The signals received by the two ears of the test head are captured electronically as a high-resolution digital recording. Each recording is processed and analyzed by the MDAQS module, which will generate the four MOS values and information about the loudness and timing details of the captured signals.
How was MDAQS developed?
HEAD acoustics began the development process by conducting “jury studies” (listening tests) over several years to gather data. The researchers found reliable test results could be achieved even with naïve test subjects. Much time was spent figuring out which dimensions were essential to overall quality. Informed by these two French studies, analysis was conducted to test if three attributes — timbre, distortions, and immersiveness — could adequately describe audio quality. HEAD acoustics used a linear regression approach to find nearly-perfect correlation between the auditory data and predictions, indicating that these attributes captured relevant factors for the listeners. This led to the three attributes becoming the cornerstones of MDAQS.
The researchers learned that the absolute category rating (ACR) doesn’t work for audio quality evaluation and instead moved ahead with comparison category rating (CCR). The CCR test design compares two audio systems playing the same stimulus. Test subjects listen to two audio samples and compare them for several parameters. This is done using a preference rating ranked on a scale of -3 (strongly prefer sample A) to +3 (strongly prefer sample B). This approach allows data verification by checking for circular triads (test subjects that rate A > B > C and C > A). Each participant was exposed to 90 different comparisons, which took 45-90 minutes.

The music sources were chosen based on their genre variety and ability to stimulate different frequency ranges. For example, classical piano music, bluegrass, rock, pop, etc., each put different stresses on an audio system. The final MDAQS stimulus signal includes test sweeps for basic distortion calculations, but no listening test participants listened to sine sweeps.
Listening tests involved several hundred participants, all considered naïve listeners or general consumers with no special training. The tests involved more than 10,000 individual comparisons, which had to be translated to absolute ranking for analysis. Two separate batches of data were produced: one for training the MDAQS algorithm and one for validating it.
The two key MDAQS components are an analysis stage that contains specific components for the individual attributes (see above) and a trained regression that uses the results of the listening tests to establish a relationship between the analyses and human perception.
How will SoundGuys be using MDAQS?
From now on, we will include MDAQS values in our headphone, earbud, speaker, and soundbar reviews to provide a reliable, meaningful sound quality assessment score. We also plan to bring them to versus articles and use them for best lists. MDAQS identifies strengths and weaknesses and can describe the audio quality of many product categories we cover. It’s a powerful tool to simplify complex data and allow us to help you make more informed decisions about the audio products you choose.
In addition to publishing the scores, we will provide charts for quick reference. Here are some example results for three devices (a Bluetooth speaker, a bookshelf speaker, and a high-quality headphone) that illustrate MDAQS’ ability to identify strengths and weaknesses. Some product categories have a natural disadvantage, and the review will provide context. For example, Bluetooth speakers are typically small and portable and will garner a low rating for immersiveness; a bookshelf speaker will have a better-tuned sound, producing a decent rating for timbre; a headphone can easily offer excellent performance all around.
Publishing MDAQS numbers won’t affect how we write about our experience of the headphones, earbuds, or loudspeakers. We will still write about how things sound to us, as that’s the only perspective we can offer on the subjective side. It doesn’t have to tie in perfectly with what the MDAQS algorithm says, just as SoundGuys reviewers don’t have to prefer the SoundGuys preference curve for headphone frequency response above all else.
We are here to give you a perspective. If every word of the review had to tie directly to the objective metrics, we wouldn’t need reviewers at all; it could be automated! Instead, here’s what you get in our full product reviews:
- Sound quality scores produced by a virtual panel of listeners, as modeled by the MDAQS algorithm.
- A detailed, first-hand account of what it’s like to use the product and a sound quality assessment by one of our qualified reviewers, using descriptive terms we’ve agreed are meaningful, together with links to the songs that helped them draw their conclusions.
Including MDAQS in our reviews will make identifying the best-sounding products faster and easier for visitors to our site, while our review text provides additional subjective nuance and insights about the hands-on experience of using the products to complete the picture.