All products featured are independently chosen by us. However, SoundGuys may receive a commission on orders placed through its retail links. See our ethics statement.
SoundGuys headphone preference curve validated in AES paper
Published onDecember 8, 2023
At SoundGuys, we like to keep up with current scientific research in our field, and the Audio Engineering Society (AES) is a splendid resource for this. Perusing the presentations at the 155th AES Convention in October 2023 in New York, one particular paper drew our attention. Titled “An Over-Ear Headphone Target Curve for Brüel & Kjær Head And Torso Simulator Type 5128 measurements,” this is clearly relevant to us, what we do, and the test equipment I use every day.
Digging in, there were some interesting surprises.
- A paper was presented at the recent AES convention in New York detailing scientific listening tests on 56 listeners in 2 countries.
- The SoundGuys headphone preference curve we created for use in our headphone assessments was included in the listening tests as part of the study.
- Our preference curve fared well in the listening tests when compared with the preference curves produced by Harman research and with the popular headphone models selected.
Who did this study?
Gabriele Ravizza of FORCE Technology’s SenseLab (Denmark) presented the paper together with colleagues Christer P. Volk and Tore Stegenborg-Andersen, with the collaboration of co-author Professor Julián Villegas from Aizu University, Japan. In this work, the team investigates target frequency response curves for headphones measured using the B&K Head and Torso Simulator (HATS) Type 5128, and the paper generated a lot of interest at the AES convention.
What was involved in the experiment?
The paper describes an investigation into the preferences of 56 listeners in 2 countries when it comes to the sound of closed-back headphones. This was achieved using carefully controlled listening tests in a study similar to those conducted by Dr Sean Olive in developing the Harman Curve for headphones.

SenseLab performs tests for many industry names, as well as ETSI/3GPP and the Bluetooth Special Interest Group (SIG). It uses perceptual evaluation listening rooms with low background noise levels and controlled acoustic properties for its listening tests.
Listeners were presented with stimuli (musical extracts) over reference Beyerdynamic DT770 Pro (250 Ohm) headphones. The stimuli were all modified using a 30-band, 1/3-octave equalizer to produce a set of selected frequency response curves. Some of the response curves used were identified as headphone targets in the industry or variations devised by the study’s authors. Others were the frequency response characteristics of one of eight popular headphones and variations derived from those responses. The stated intention of this study was not to simulate wearing different headphones specifically but “to create a perceptual space of different frequency responses suitable for evaluating listener preference.”
Which response curves were selected for inclusion in the test?
Seven frequency responses were used as variables in the test, based on response curves commonly used as target responses:
- The Free-Field (FF) and Diffuse-Field (DF) corrections for the 5128, provided by B&K (FF5128 and DF5128) — read more about these here.
- Two approximations of the Harman Curve, modified* for the B&K 5128 (APHarm2015, APHarm2018).
*These approximations, obtained from audiosciencereview.com, were calculated from the 2015 and 2018 Harman targets, modified to compensate for measurement differences between the modified GRAS 43AG Ear and Cheek simulator (used by Harman), and the B&K 5128 used in the study (and by us).
- Two further versions of the modified Harman Curve having a 2-3 dB boost between 3-9 kHz (APHarm2015v2, APHarm2018v2).
- The SoundGuys.com headphone preference target curve (Soundguys) — okay, this was unexpected!
Which headphones were characterized for the test?
The eight headphones characterized in the study were selected by being considered the most popular closed-back over-the-ear consumer devices on the market. Frequency responses were measured for the following headphones using the B&K 5128 artificial head and Listen SoundCheck audio measurement and analysis software (the same testing solution we use at SoundGuys):
- Apple AirPods Max
- Bang & Olufsen BeoPlay HX
- Beyerdynamic DT 700 Pro X
- EPOS ADAPT 600
- Jabra Elite 85h
- Shure AONIC 50
- Sony WH-1000XM4
- Anker SoundCore Space Q45
The responses from the eight headphones above were subsequently referred to as HP1 through HP8, although the numbers were anonymized, so they don’t correspond to their order as listed. The arithmetic mean of these measured responses was also calculated as an additional response curve (AvgAllmeas).
The measured frequency response of each of the eight headphones (HP1 – HP8) was modified in two different ways (Mod1, Mod2) specific to each model to investigate response variables that might affect listener preference. This produced a further 16 frequency responses.
Combined, this produced a total of 25 responses derived from the eight headphone measurements.
Thirty-two filters were created from the 32 frequency responses outlined above. These filters could then be applied to the test stimuli used in the listening tests.
Which songs were used in the listening tests?
The test stimuli comprised nine different 10-second musical excerpts; loudness matched according to ITU-R BS.1770-3 for playback in the listening tests. Specifics were not provided in the paper beyond a shortcode for each. Seven (DireStraits, FastCar, HolyGrail, Natsukashii, Pharrell, The1, Warnes) were used for listener groups in Denmark and Japan.
Two stimuli were location-specific, so they didn’t feature in both tests (Fabrikken, Hvidfugl — Denmark, Hanauta, Idol — Japan).
What did the study show?
There are many ways to slice the data produced by these listening tests. But obviously, the most crucial question is: which responses did the listeners prefer?
First, let’s look at how the listeners judged the seven frequency responses based on response curves commonly used as headphone targets, averaged across listener groups and all the musical excerpts used:
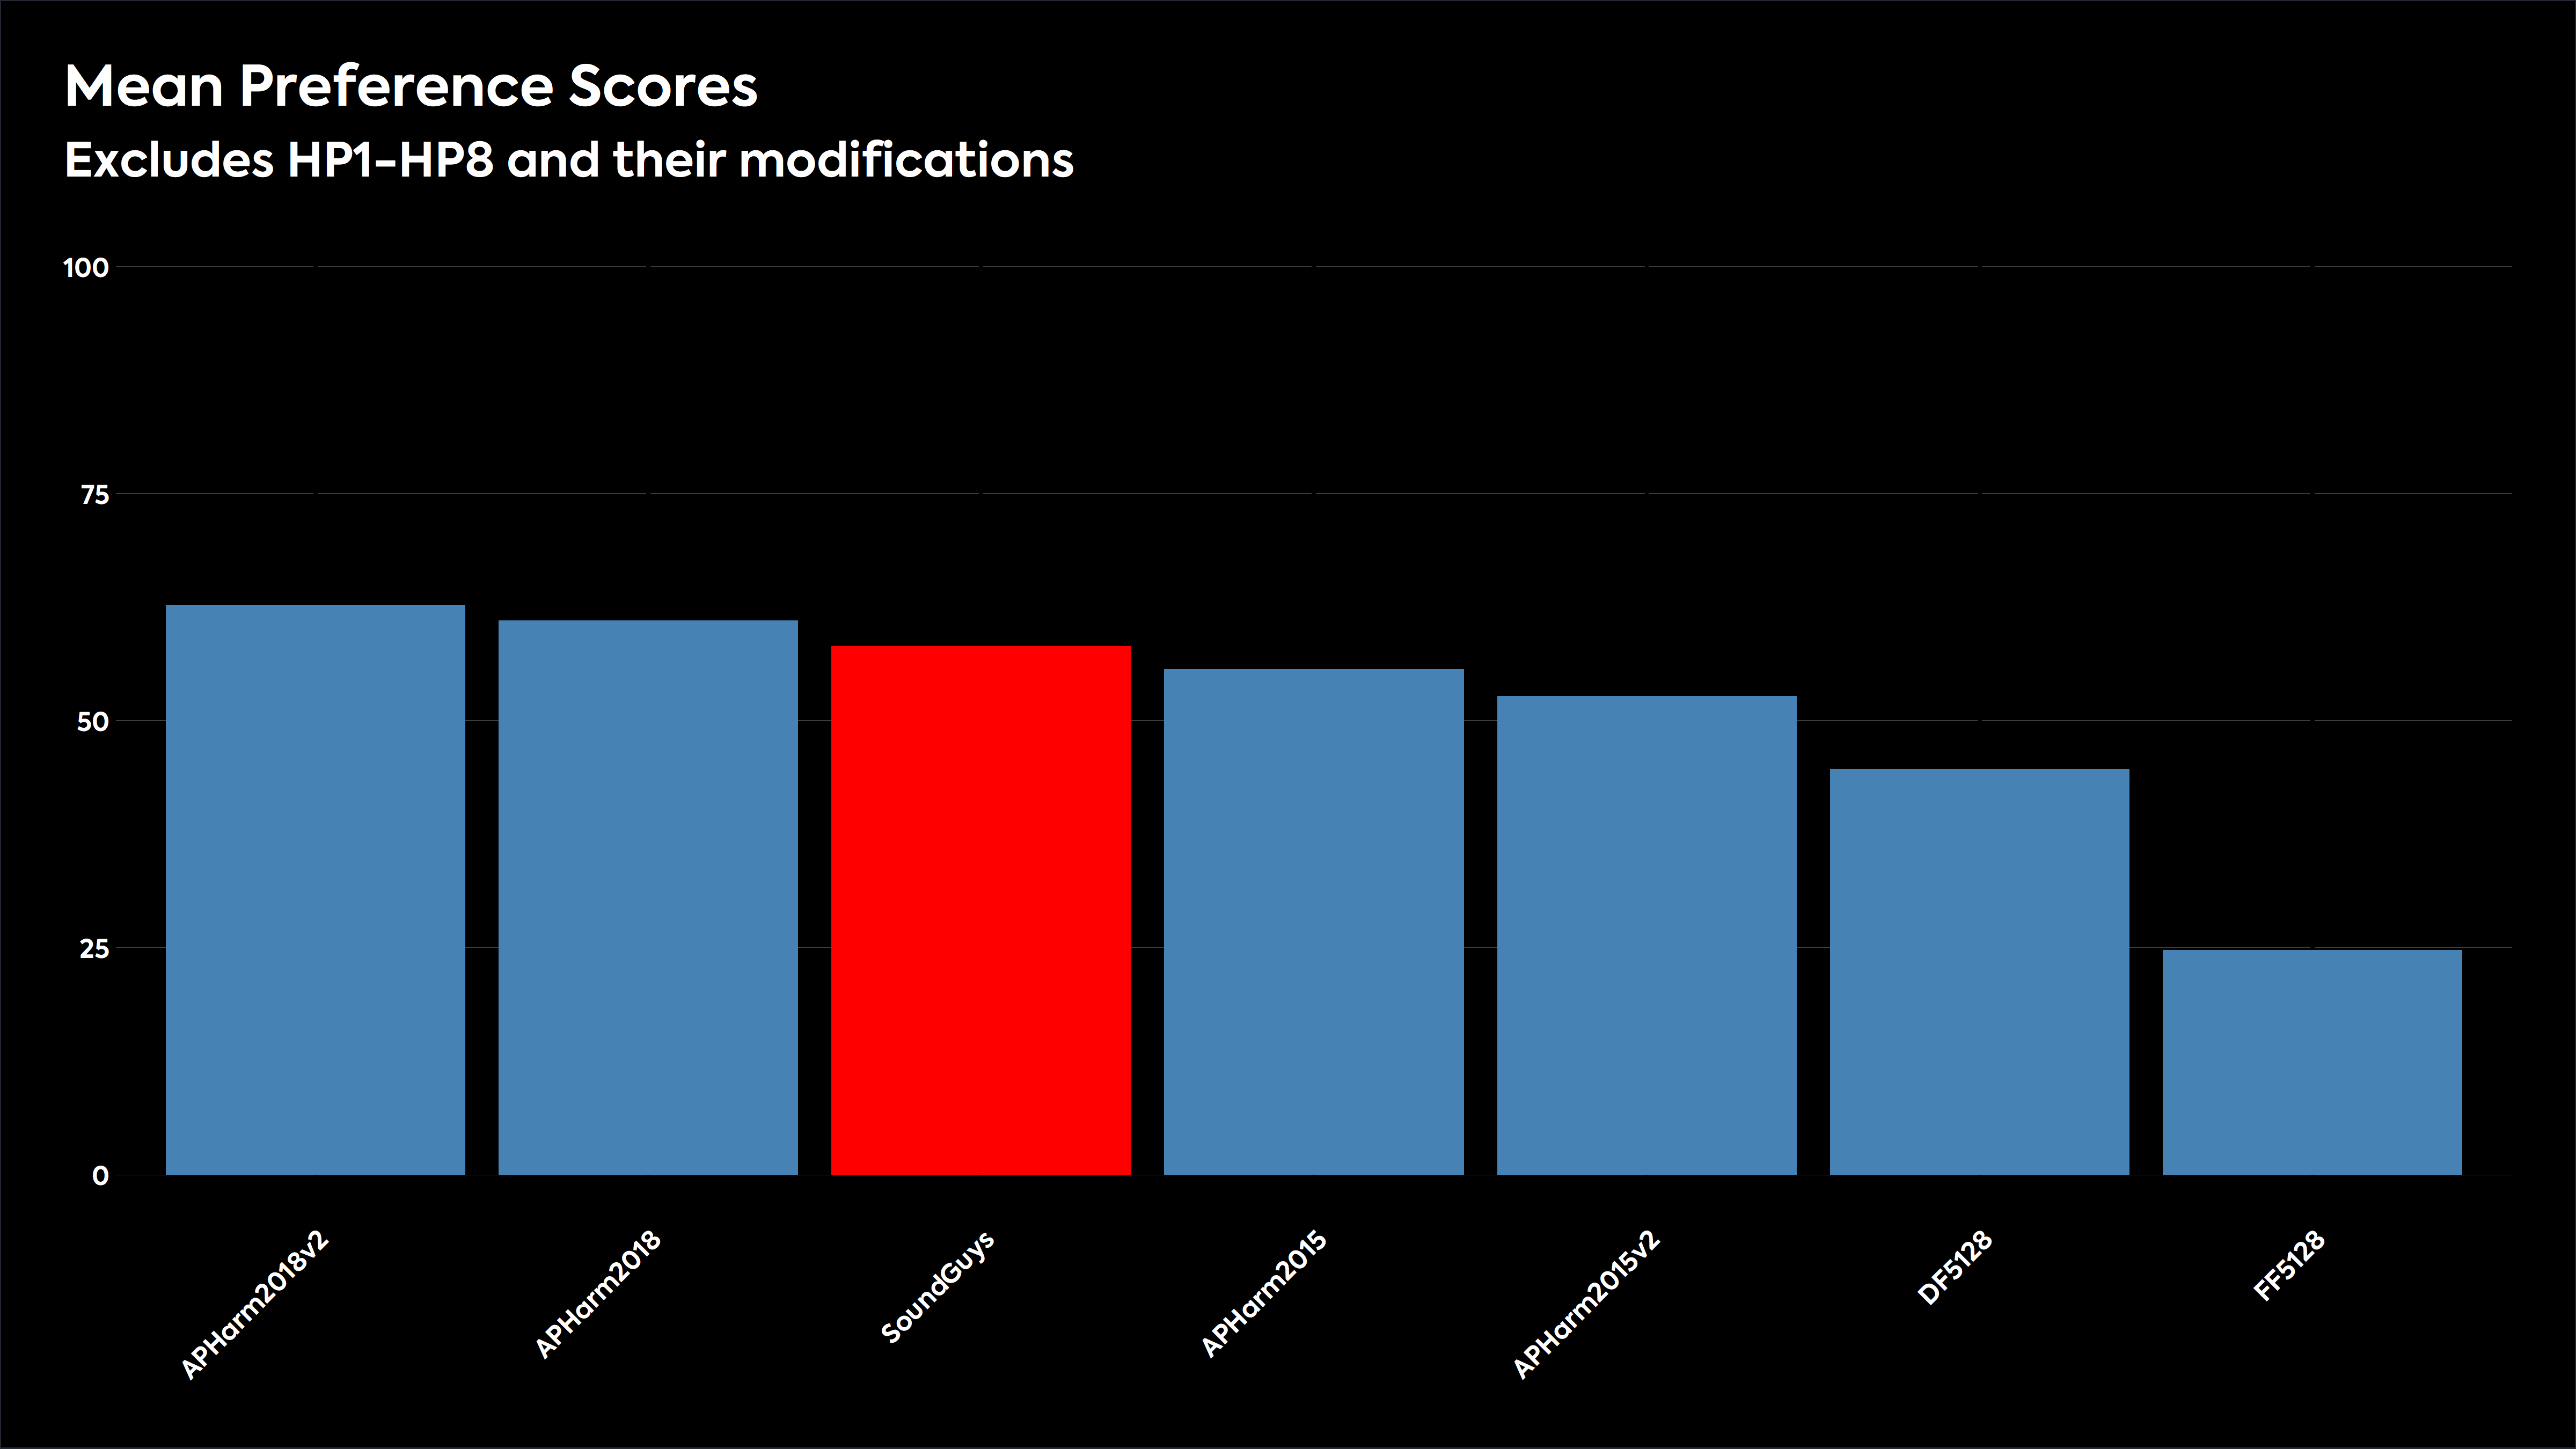
The results show that the Harman 2018 target and the variant created by the test designers were the most preferred. The SoundGuys headphone preference curve ranked 3rd, followed by the Harman 2015 target and variant. The Diffuse-field response came sixth. The Free-field response was least preferred by a notable margin.
Next, let’s see how the results stack up when the frequency responses derived from the eight headphone models and their average are included with the same data:
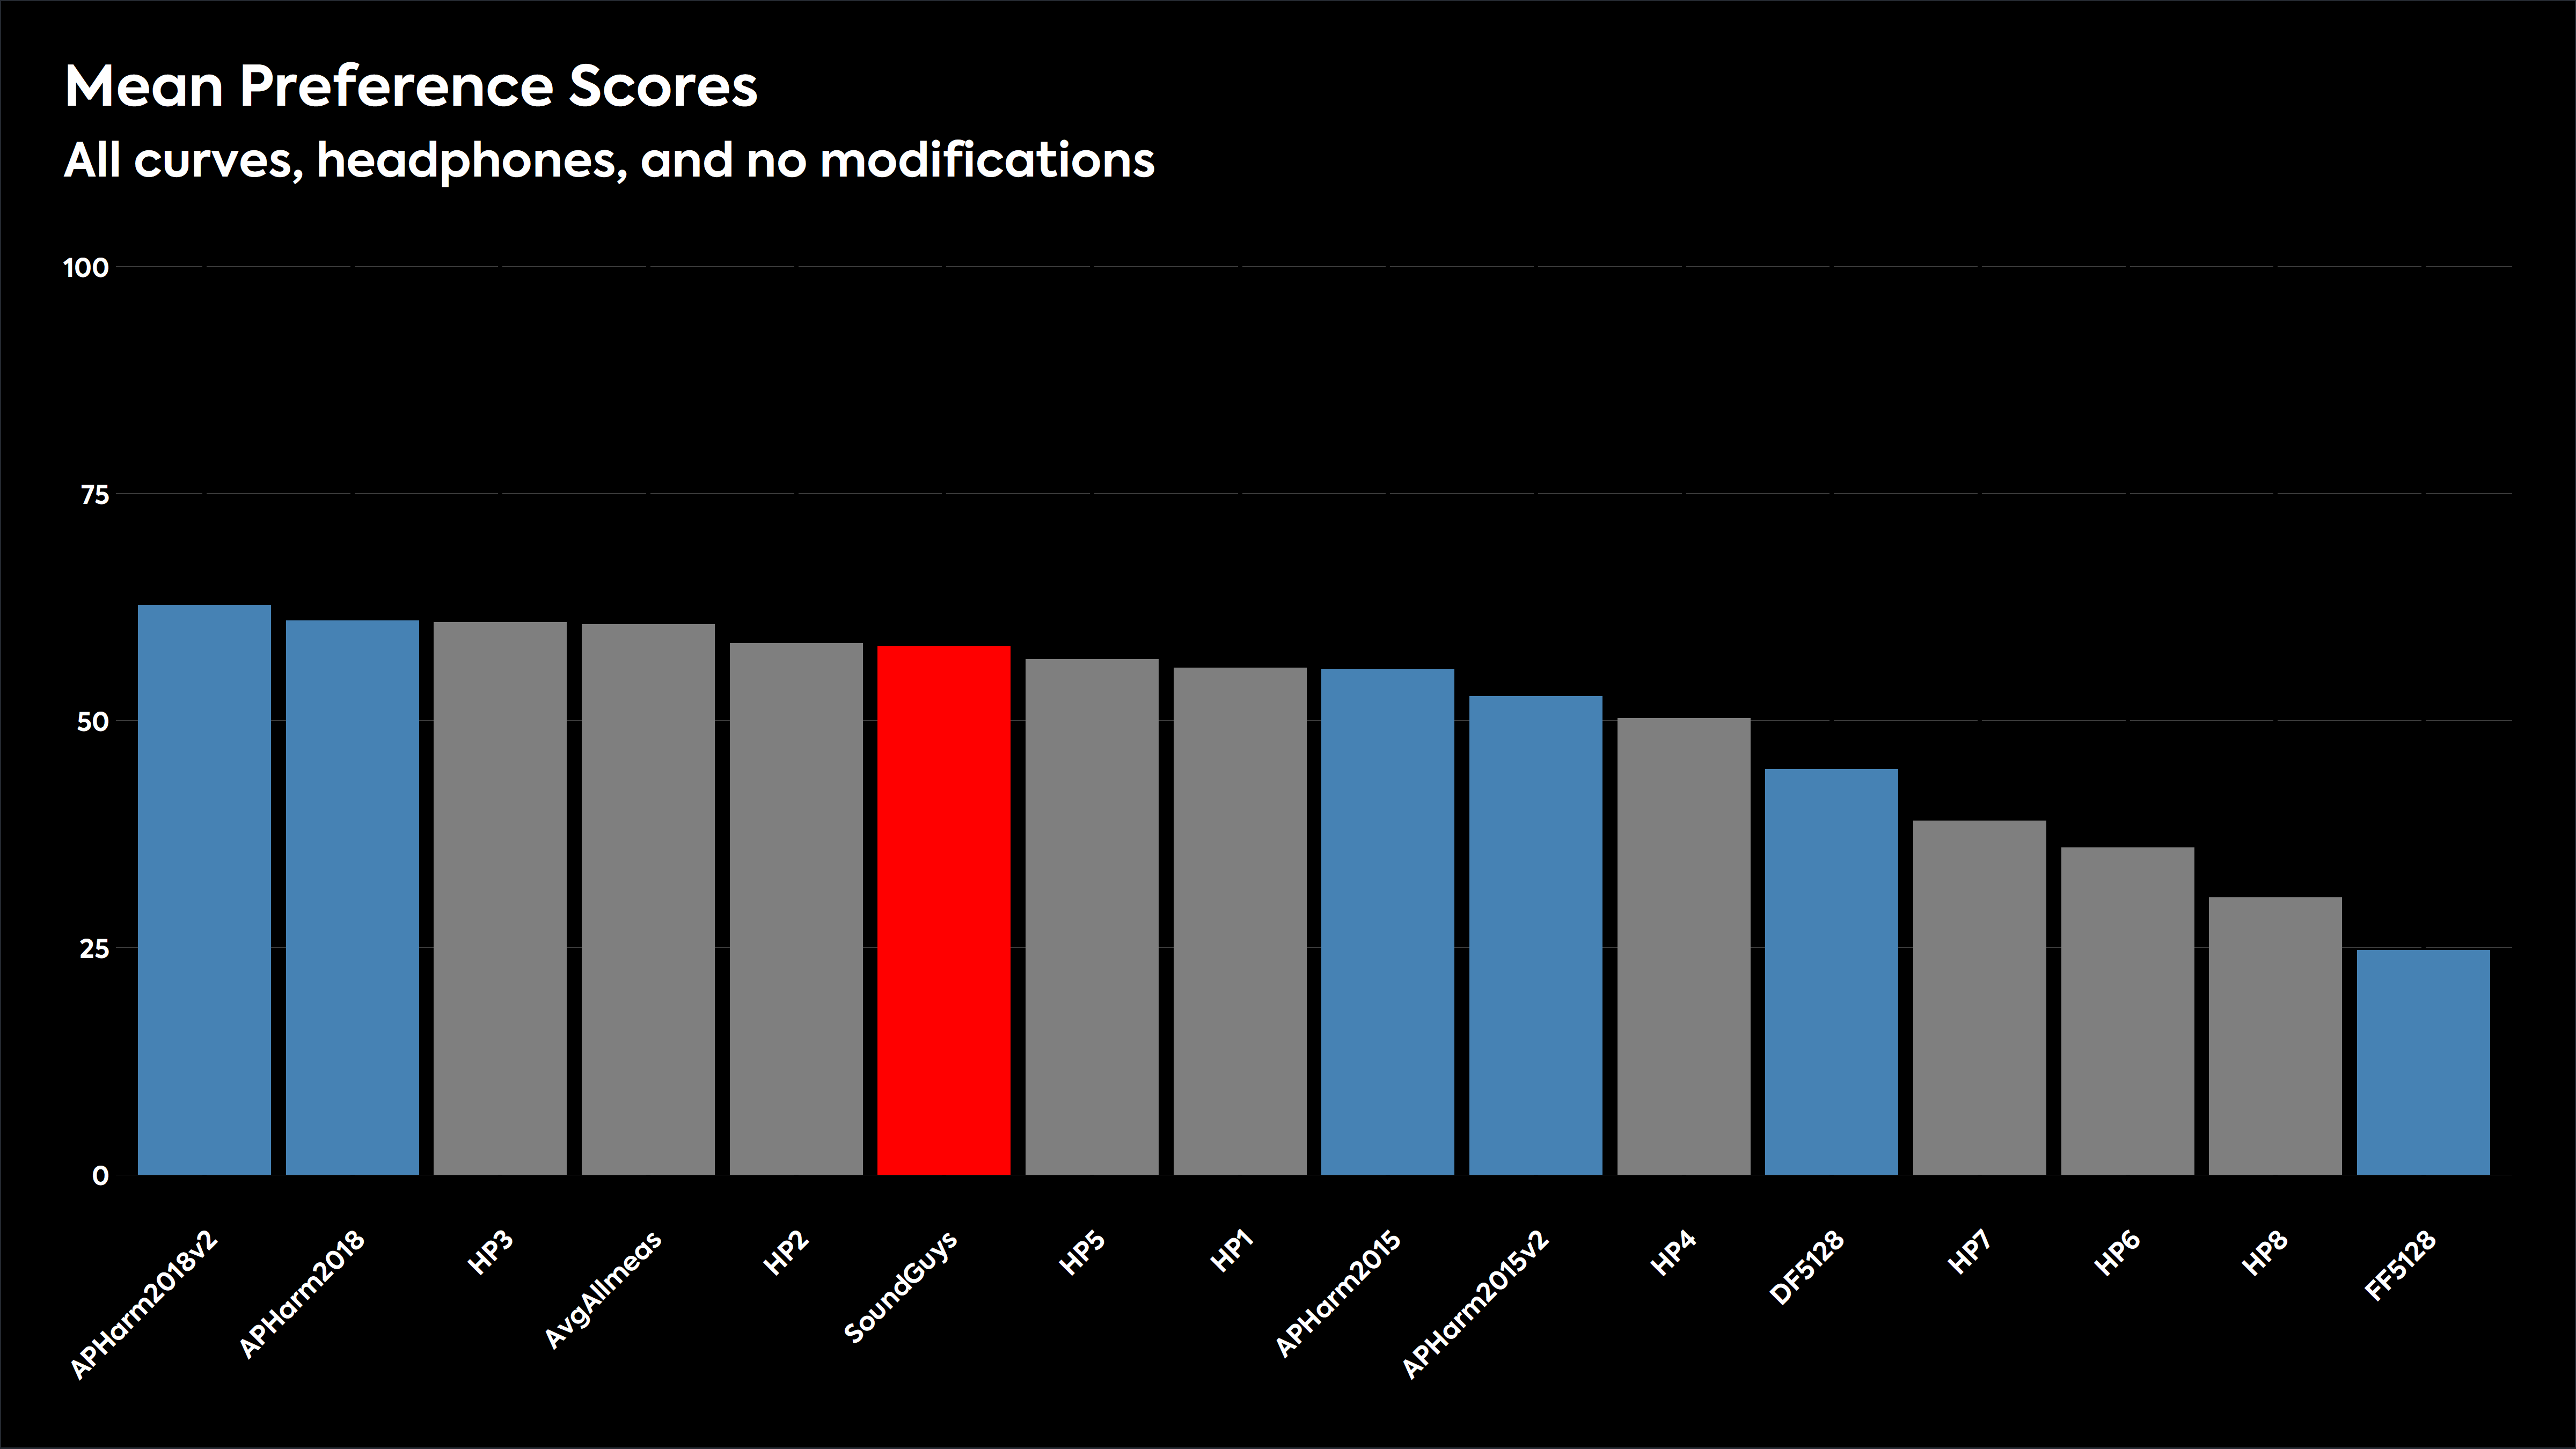
We can see from the chart that the HP3 is the most preferred headphone response, being beaten in terms of preference only by the Harman 2018 target and the variant created by the test designers. The average of the eight headphone responses was the next most preferred, followed by HP2, HP5, HP1, HP4, HP7, HP6, and HP8. Those last three were preferred less than the Diffuse-field response that was once considered ideal for headphones and headsets. The Free-field response is least preferred.
Finally, let’s look at all the frequency responses that were evaluated in the test, averaged across listener groups and all the musical excerpts used:
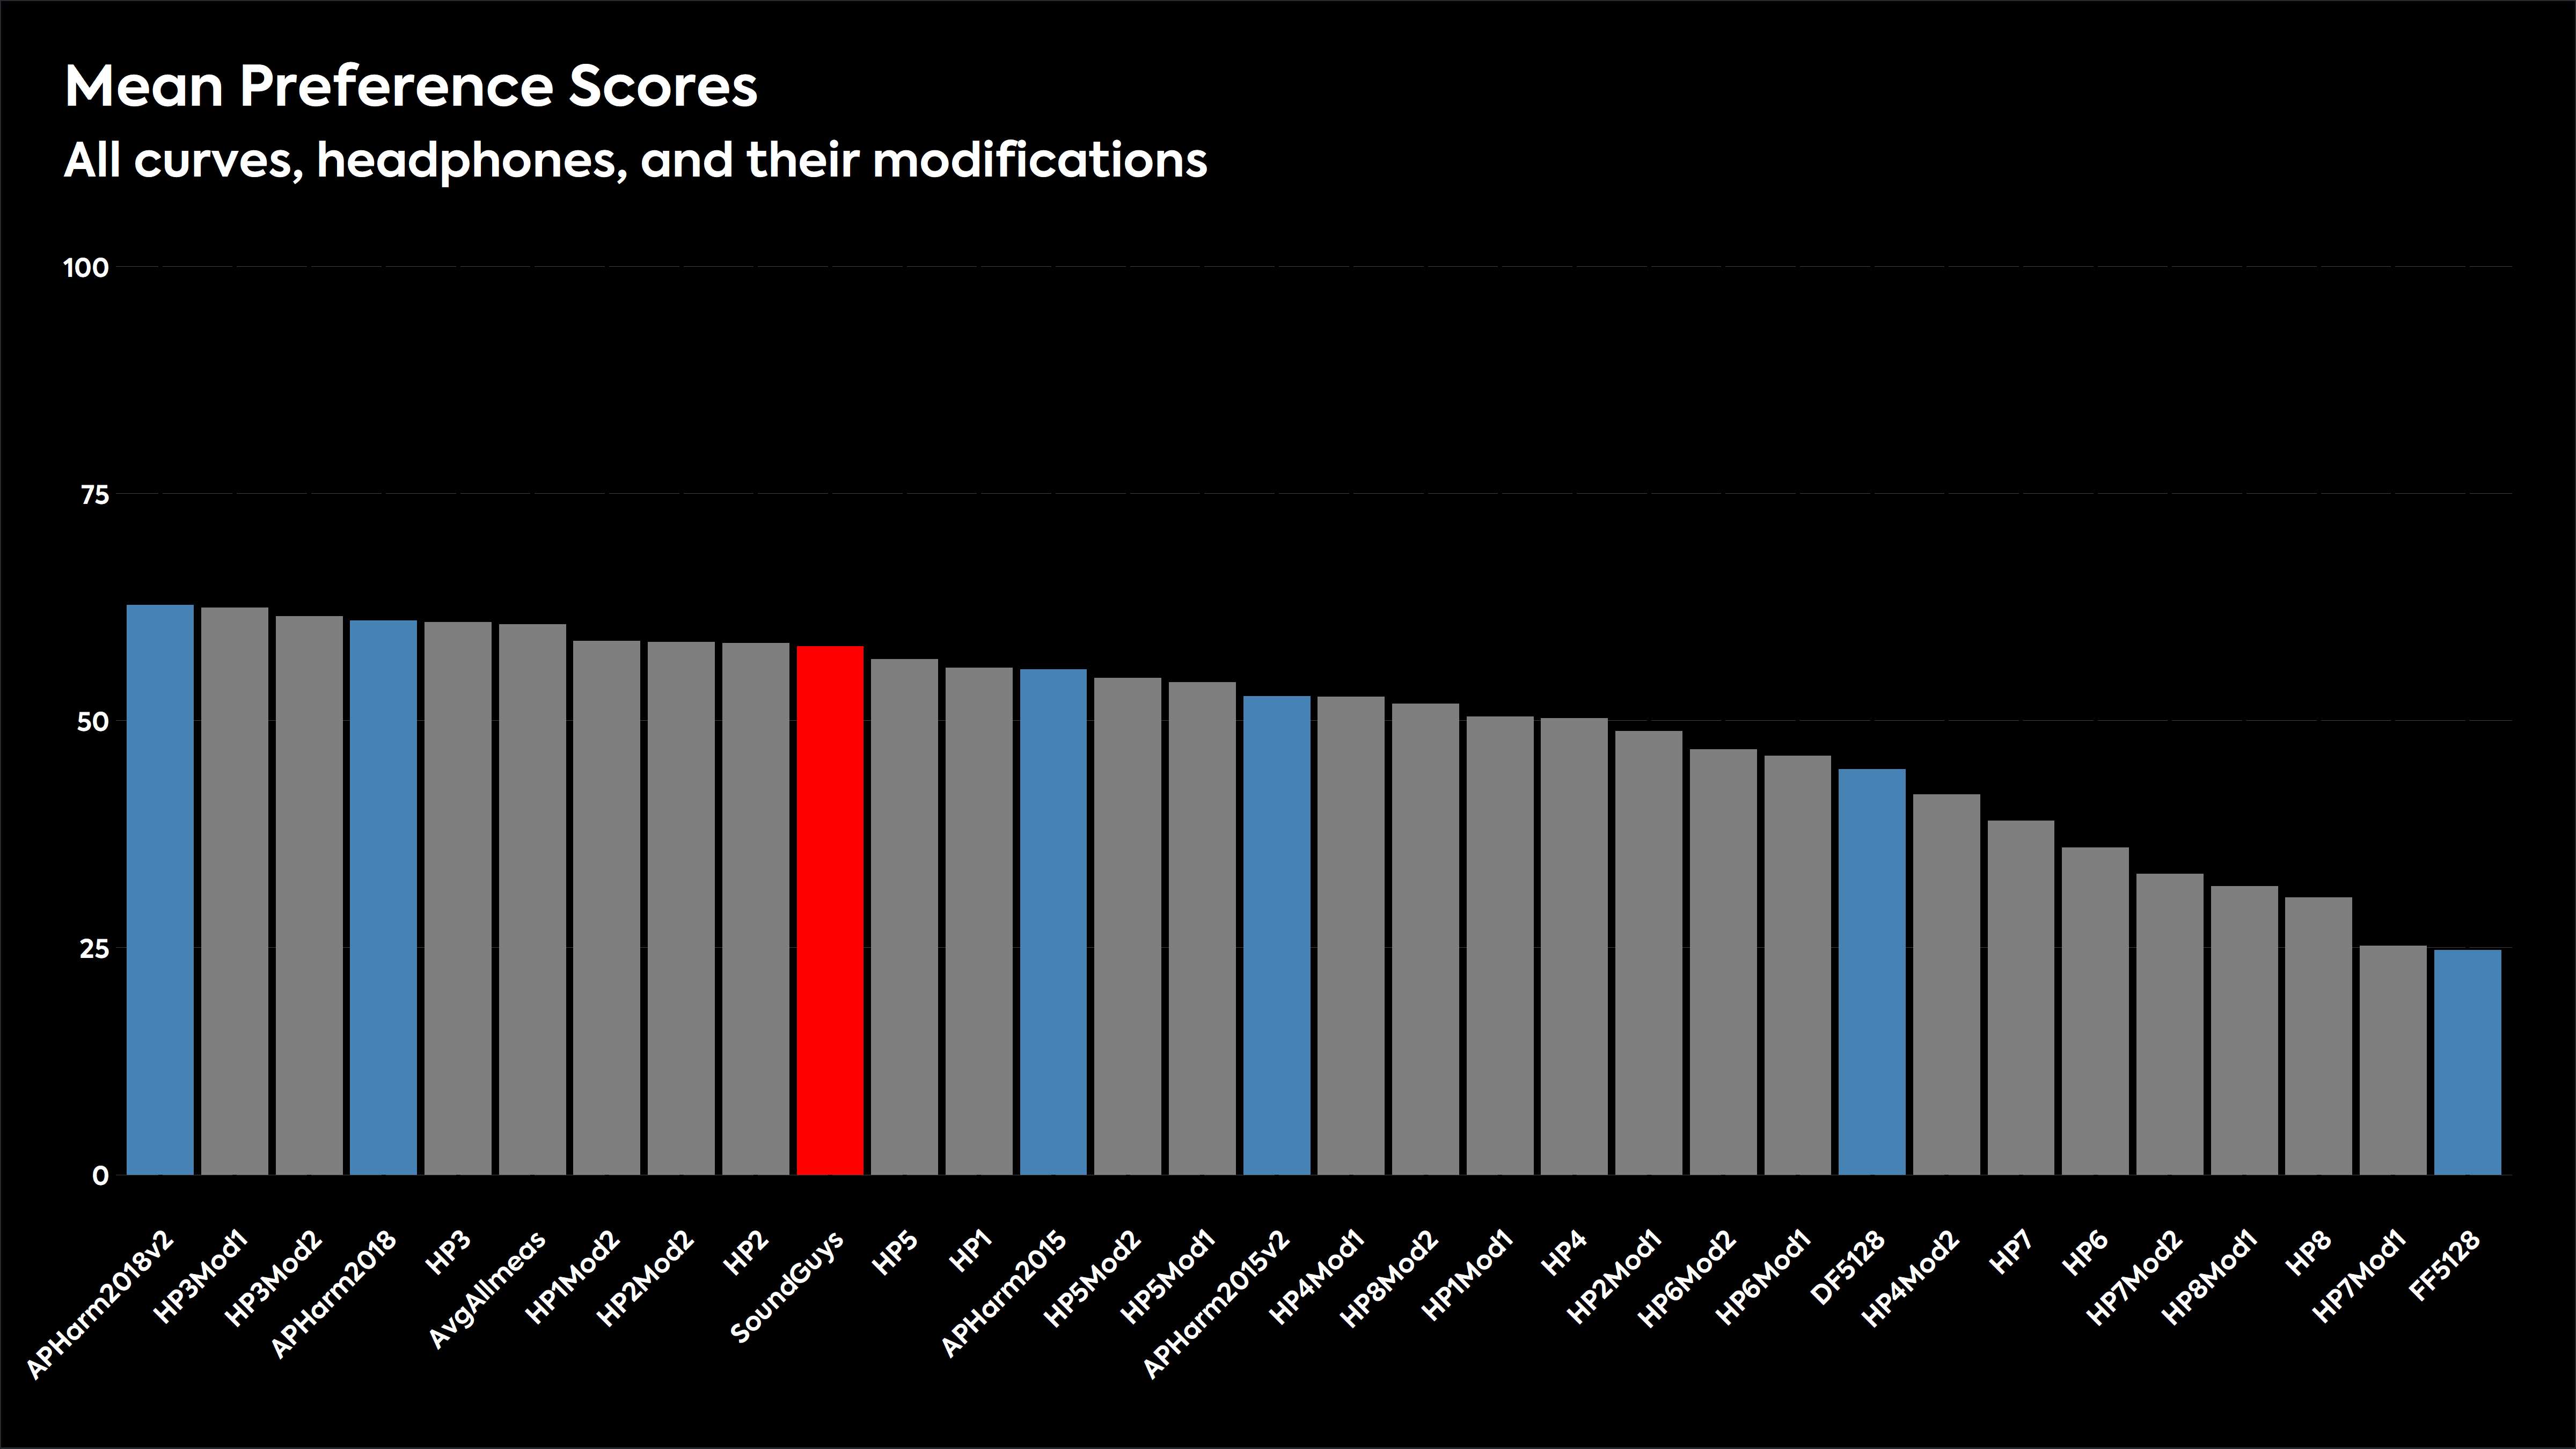
The combined data shows that when all the listening tests are considered, the modified Harman 2018 curve (having a 2-3 dB boost between 3-9 kHz vs Harman’s 2018 curve) wins out as the preferred headphone frequency response in this test. Headphone 3 (HP3) is preferred above all others in its modified forms (HP3Mod1 has a 3dB bass reduction below 160Hz, HP3Mod2 has a boost of 3dB at 4kHz and 4dB at 5kHz). The 2018 unmodified Harman research curve ranked at number four, and the unmodified headphone 3 (HP3) at number 5.
The SoundGuys headphone preference curve we established in 2021 ranked 10th out of the 32 frequency responses used in the test.
How did the listener preferences break down by song?
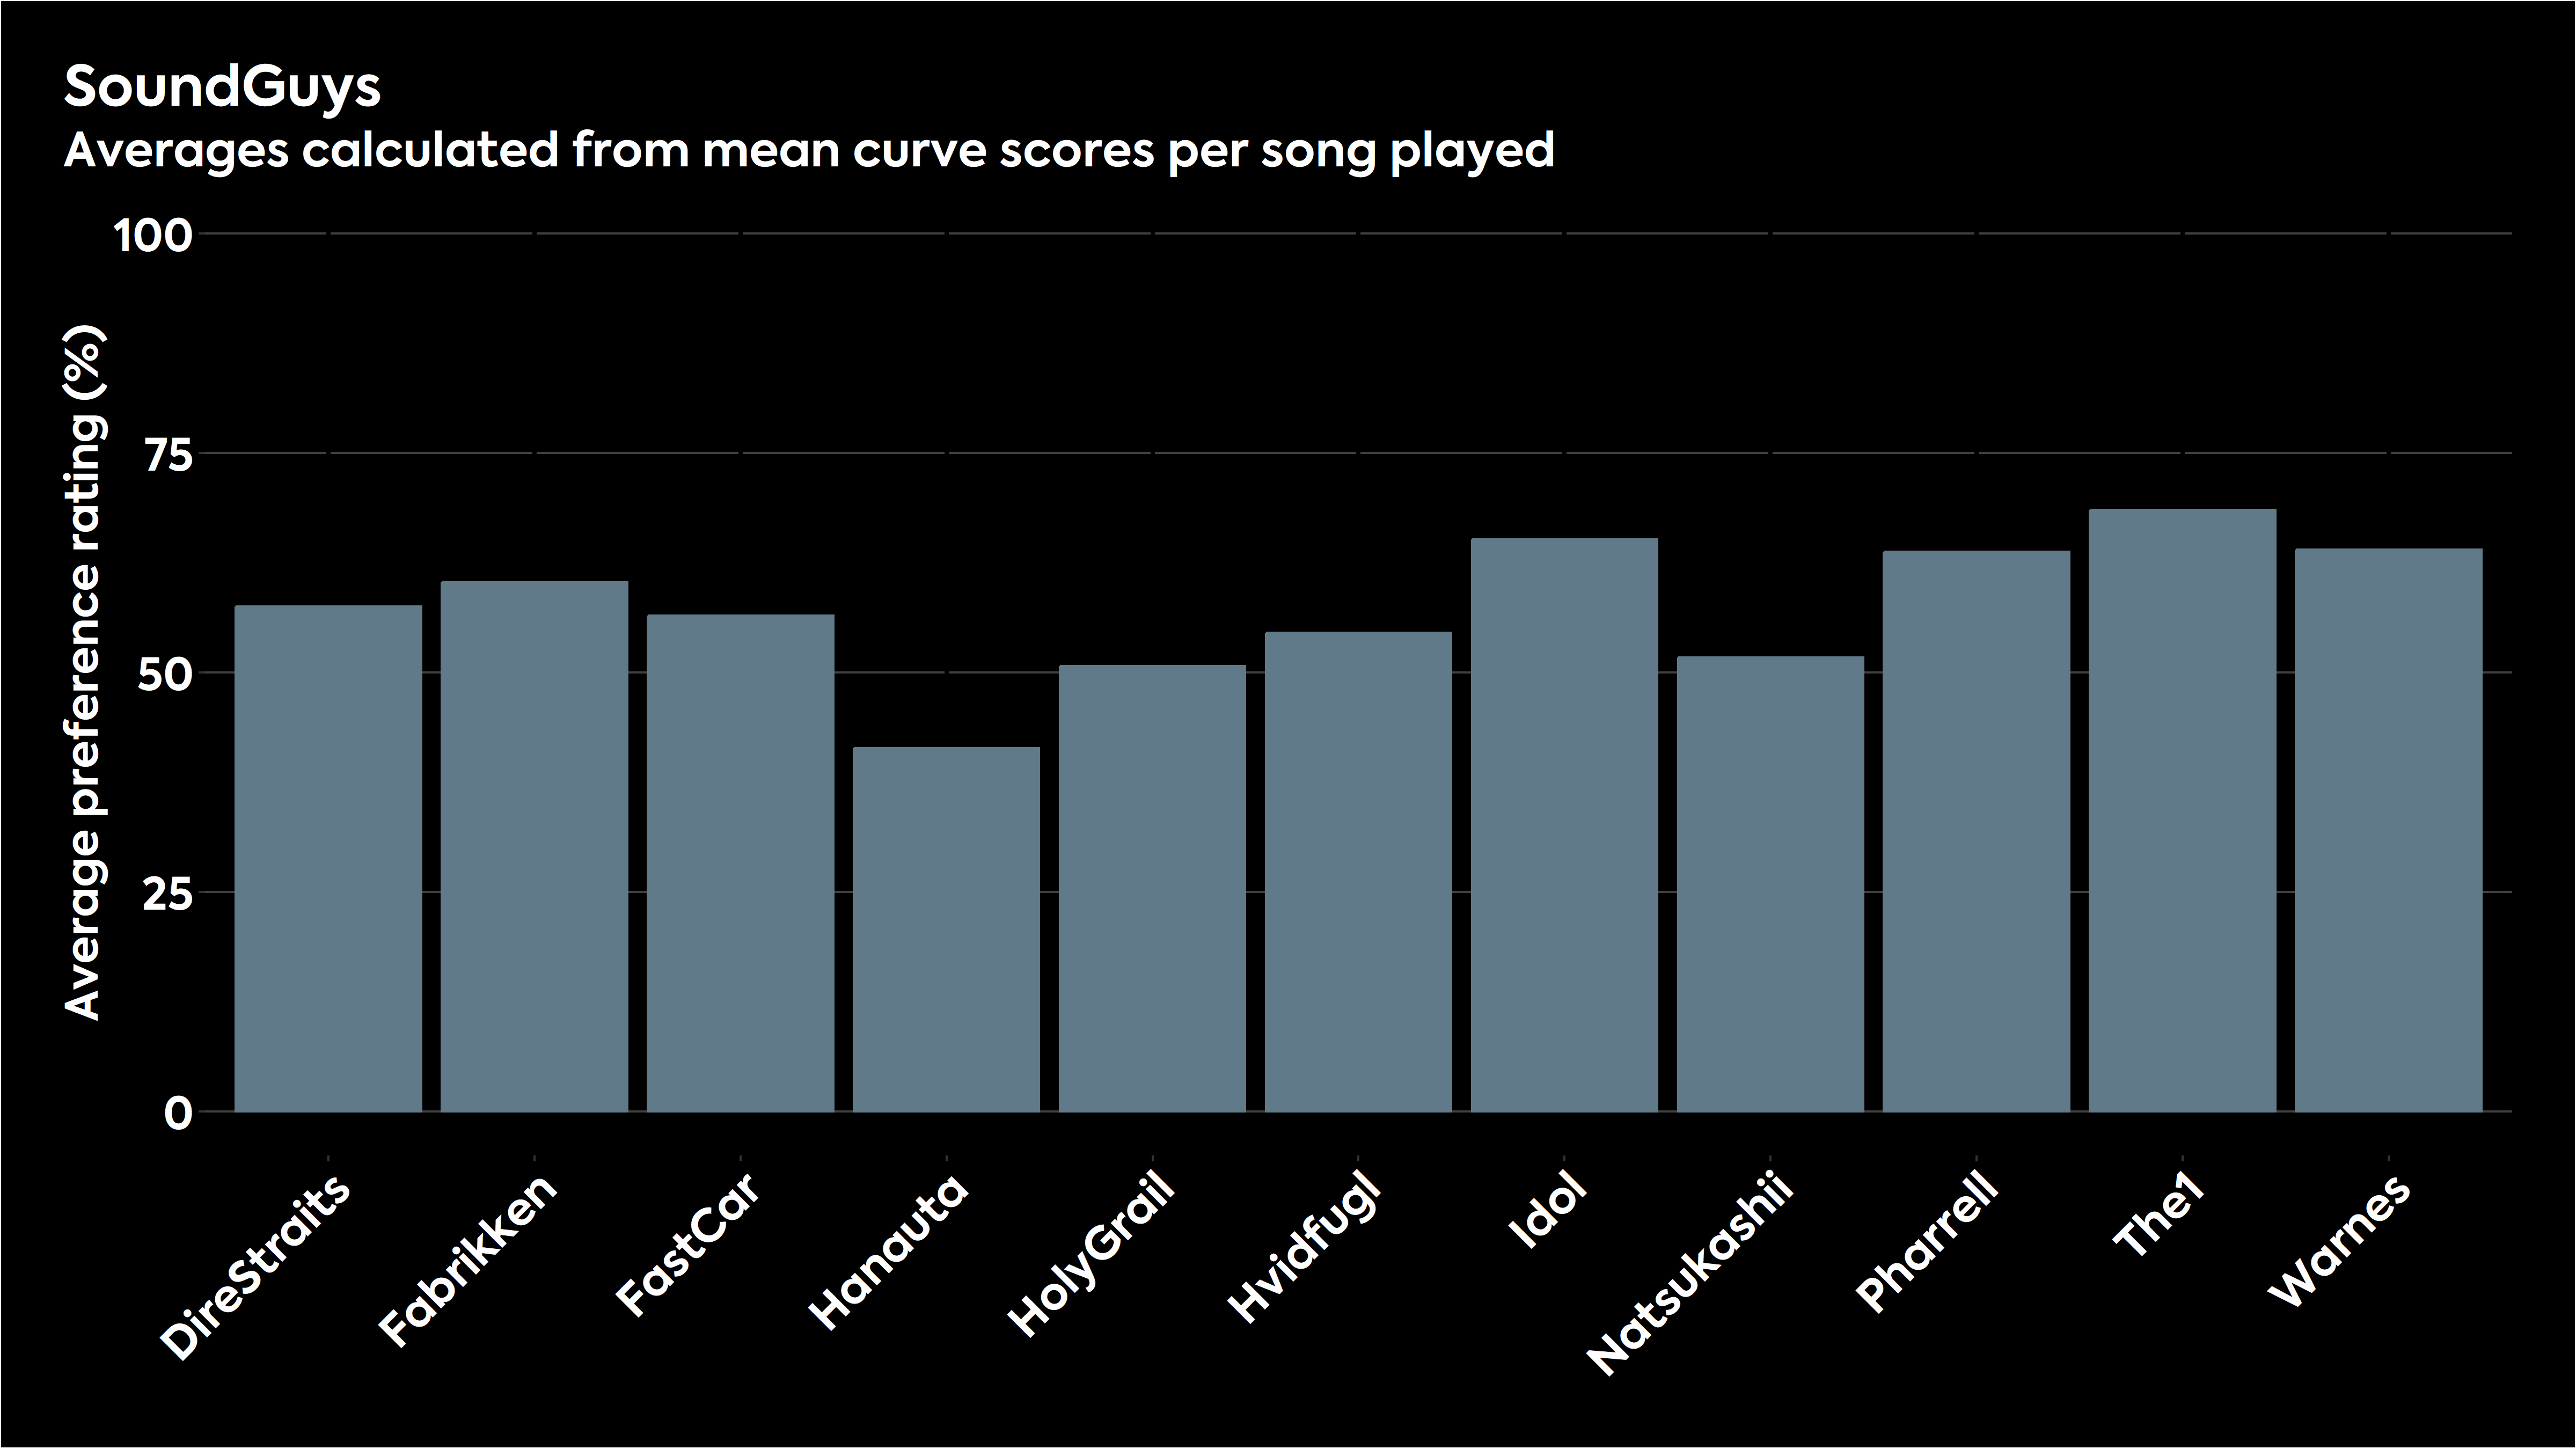
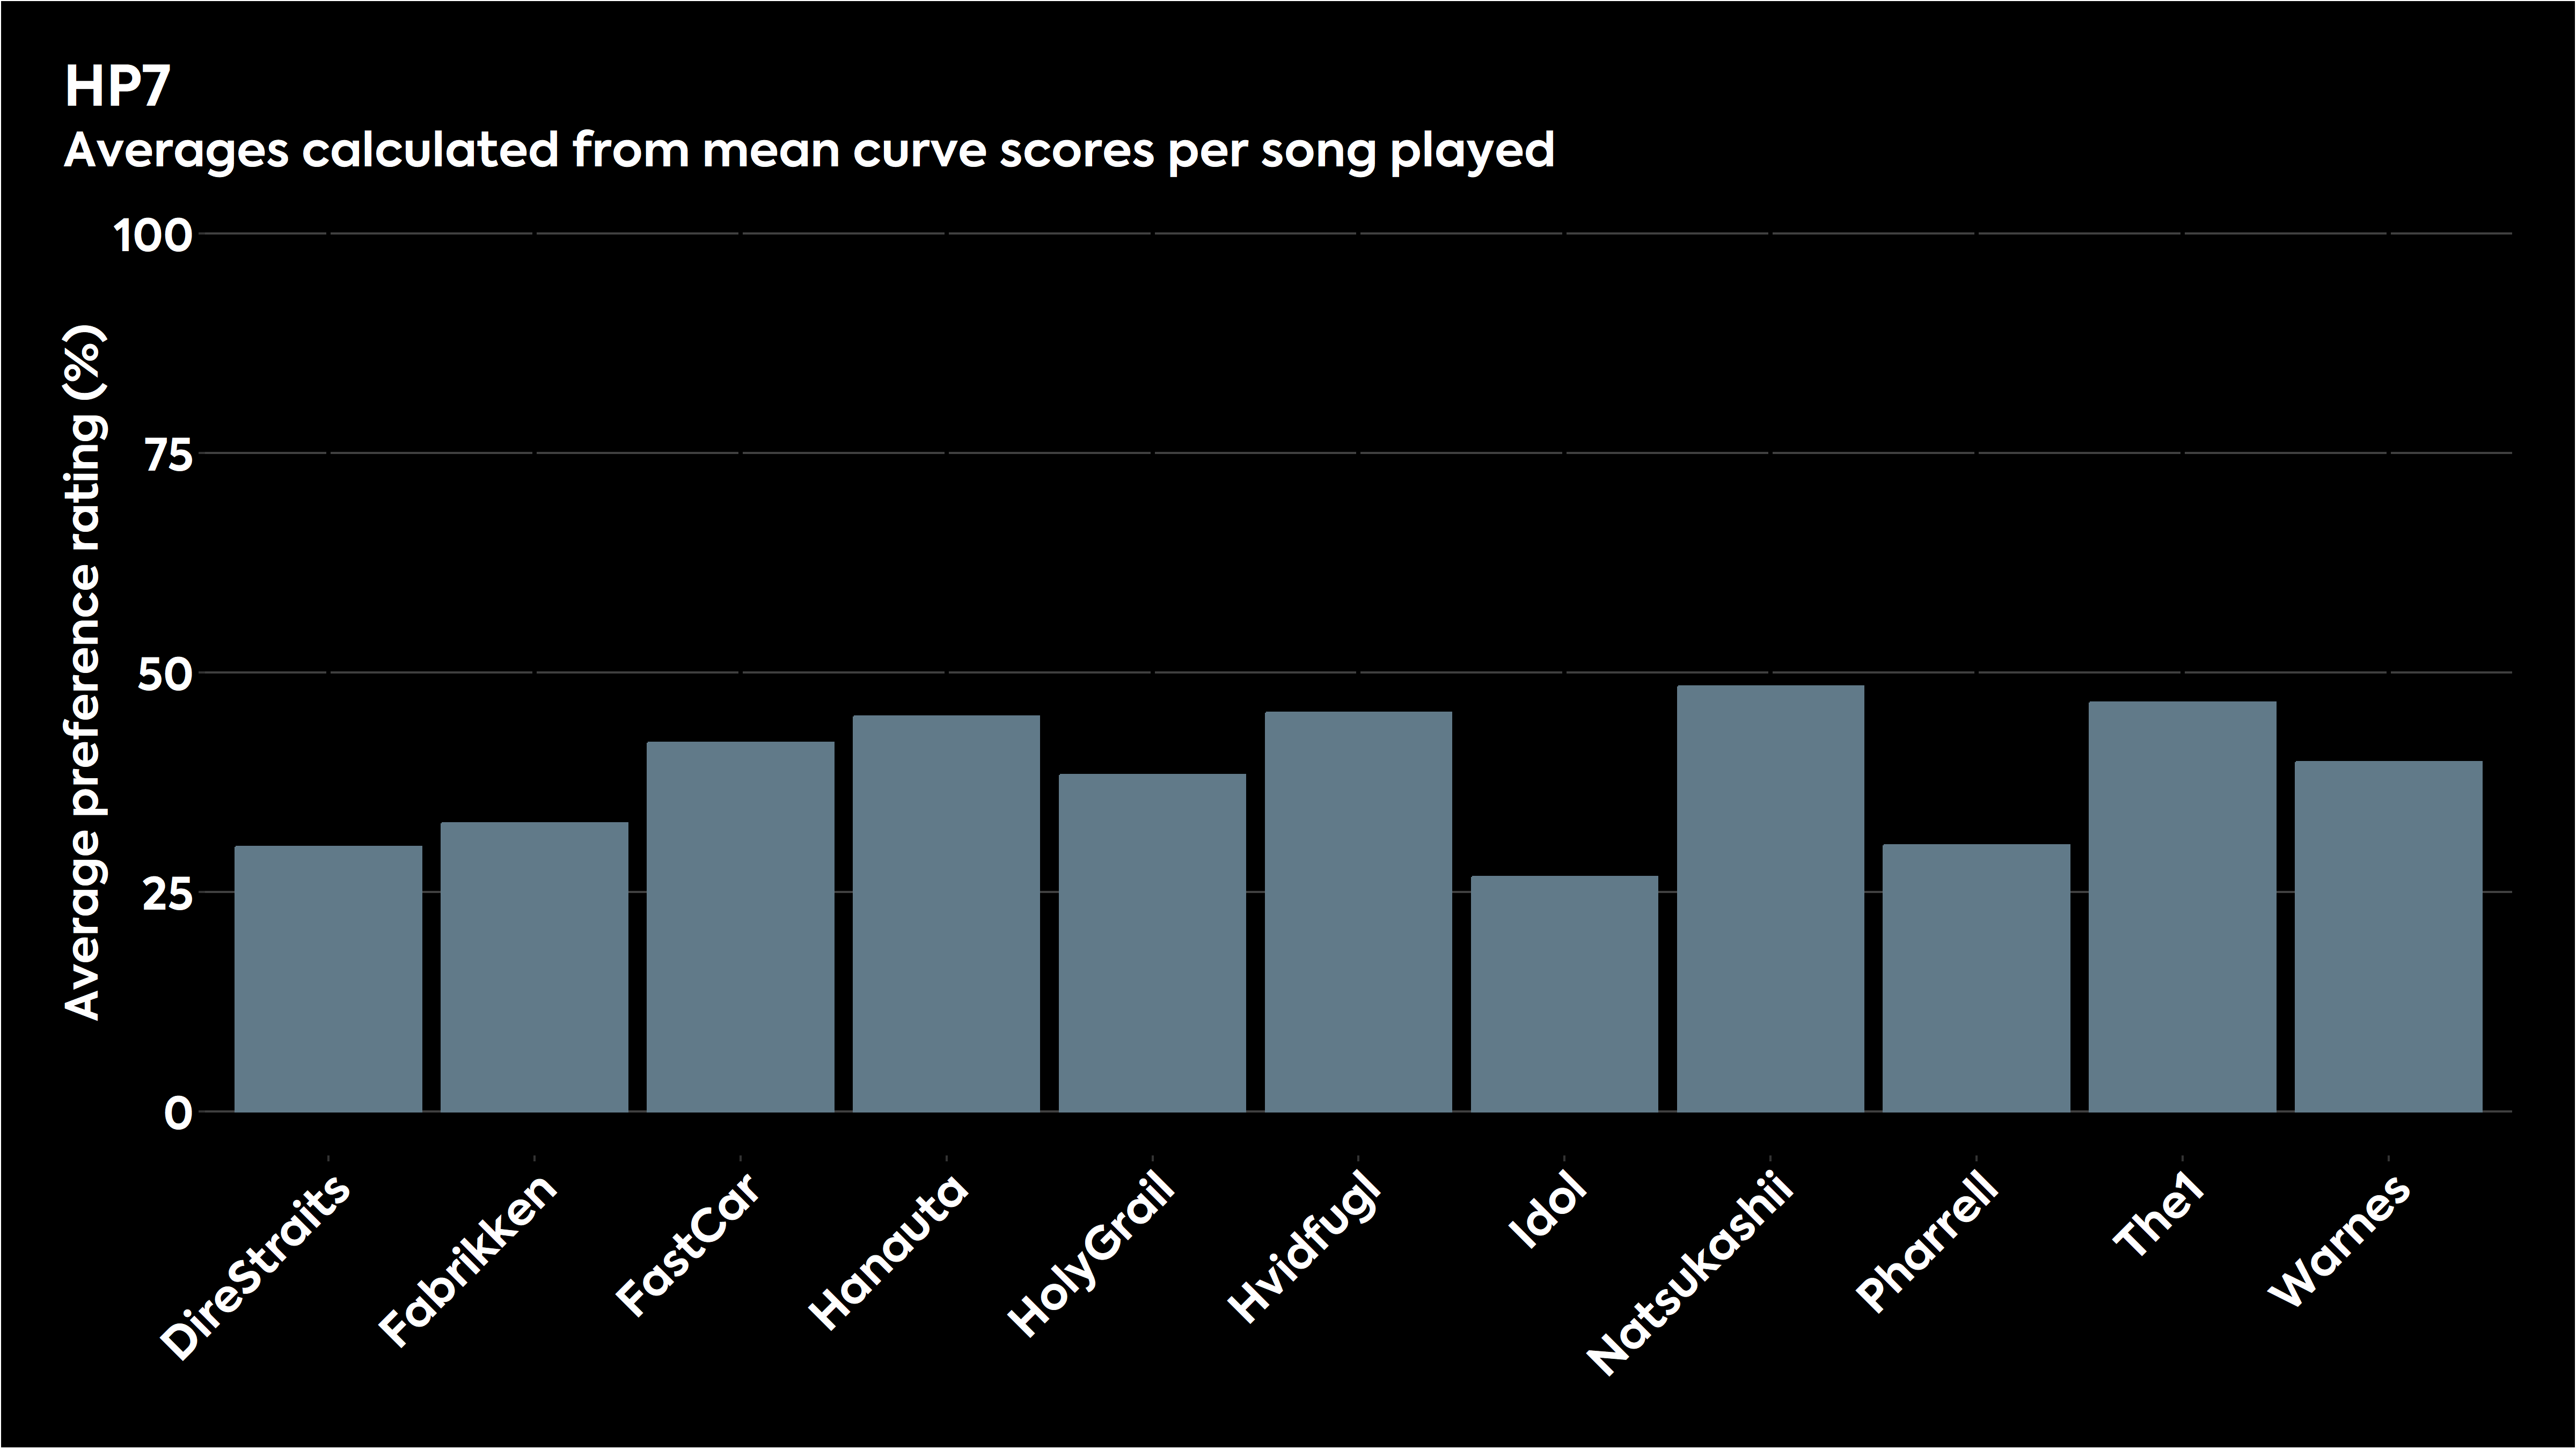
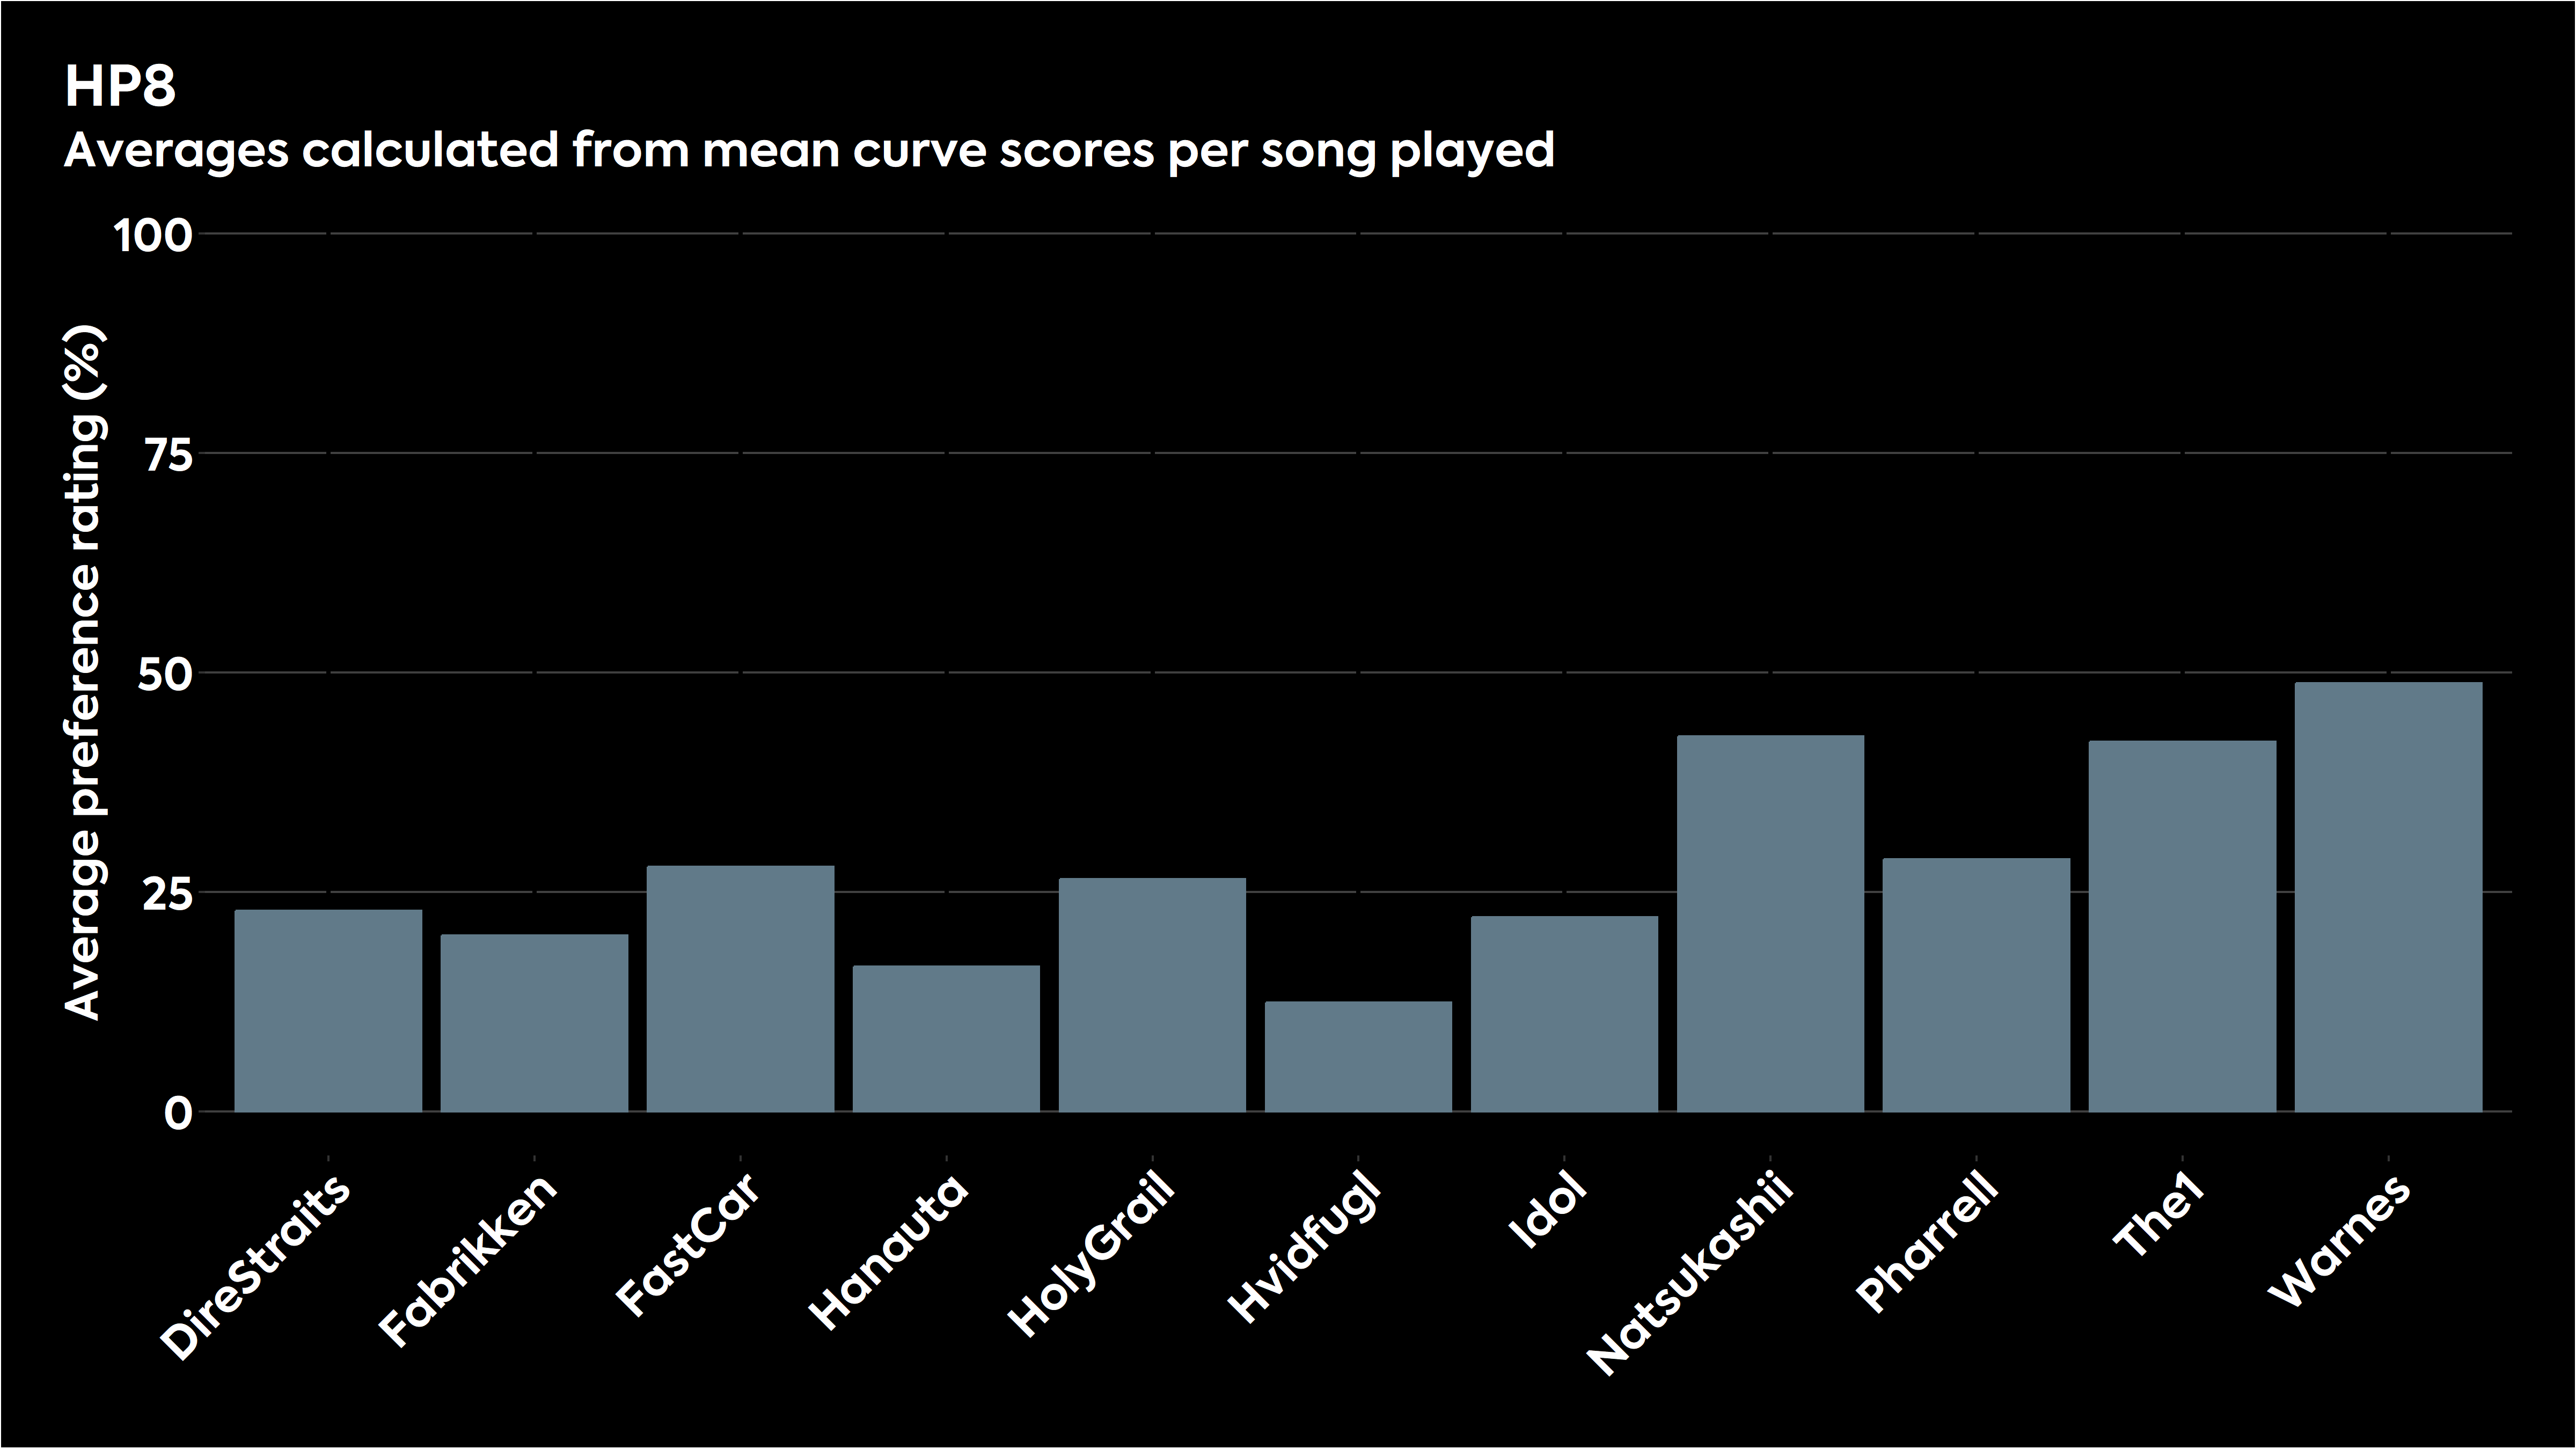
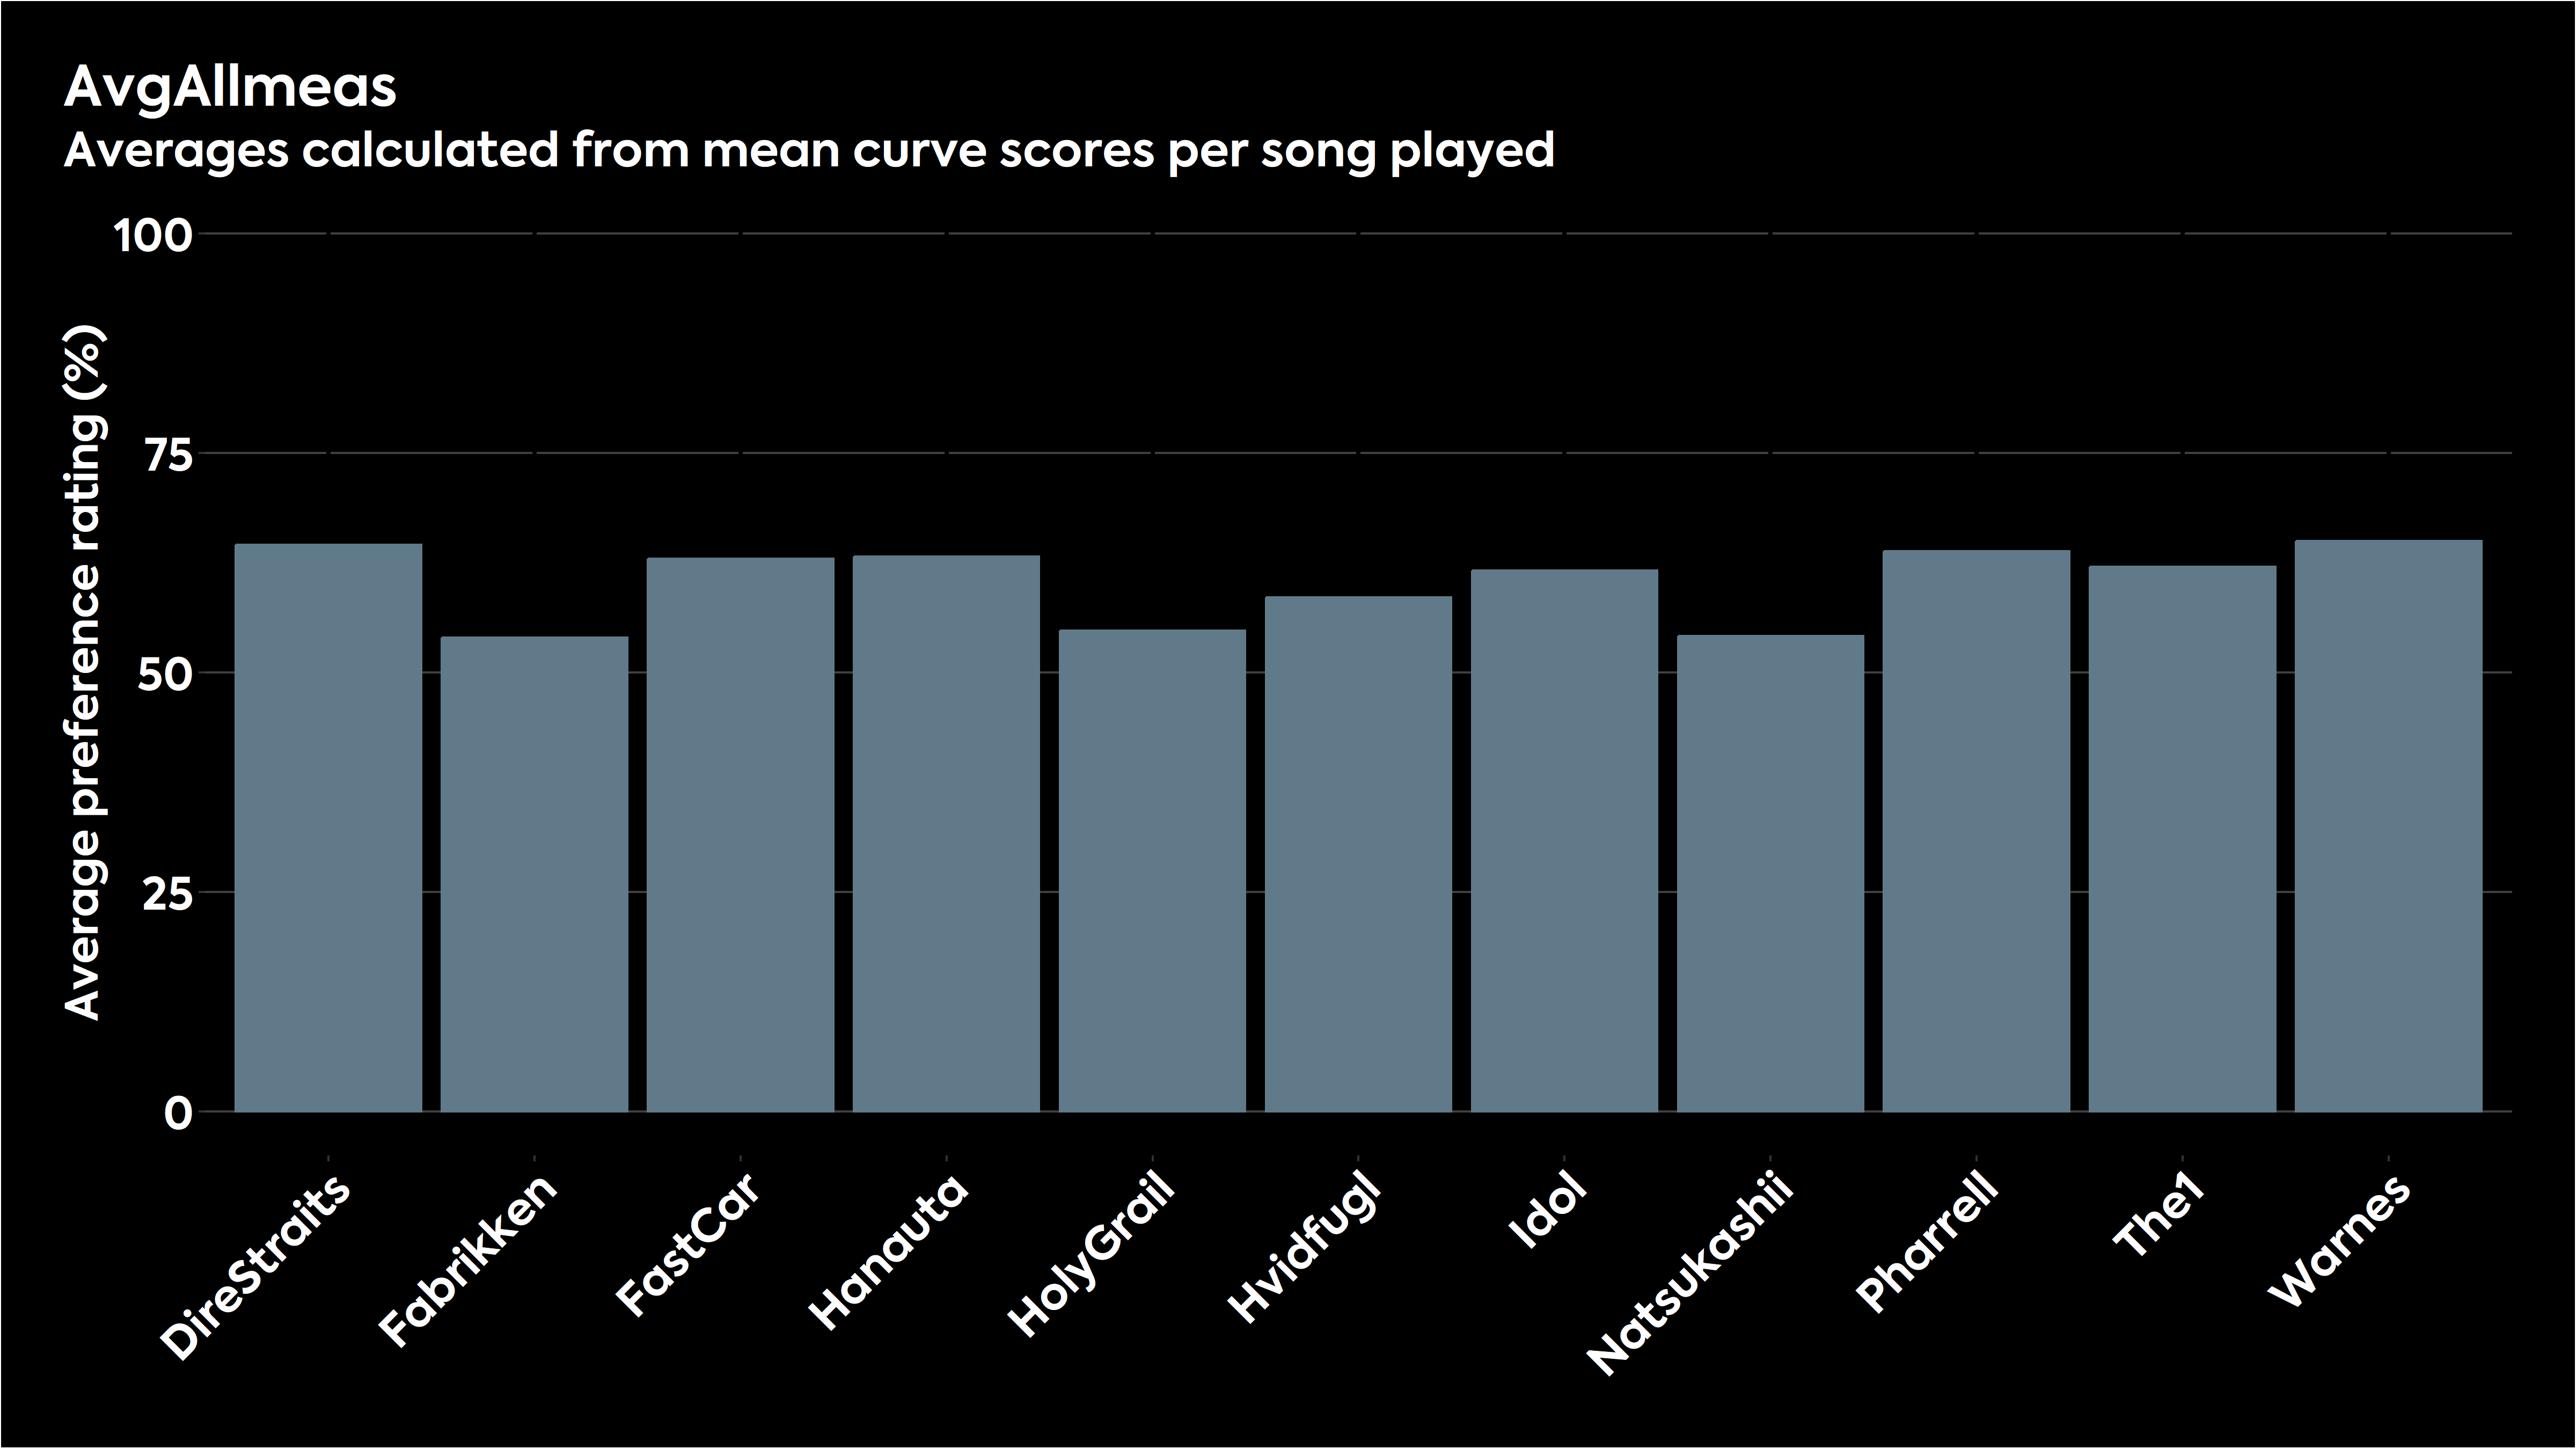
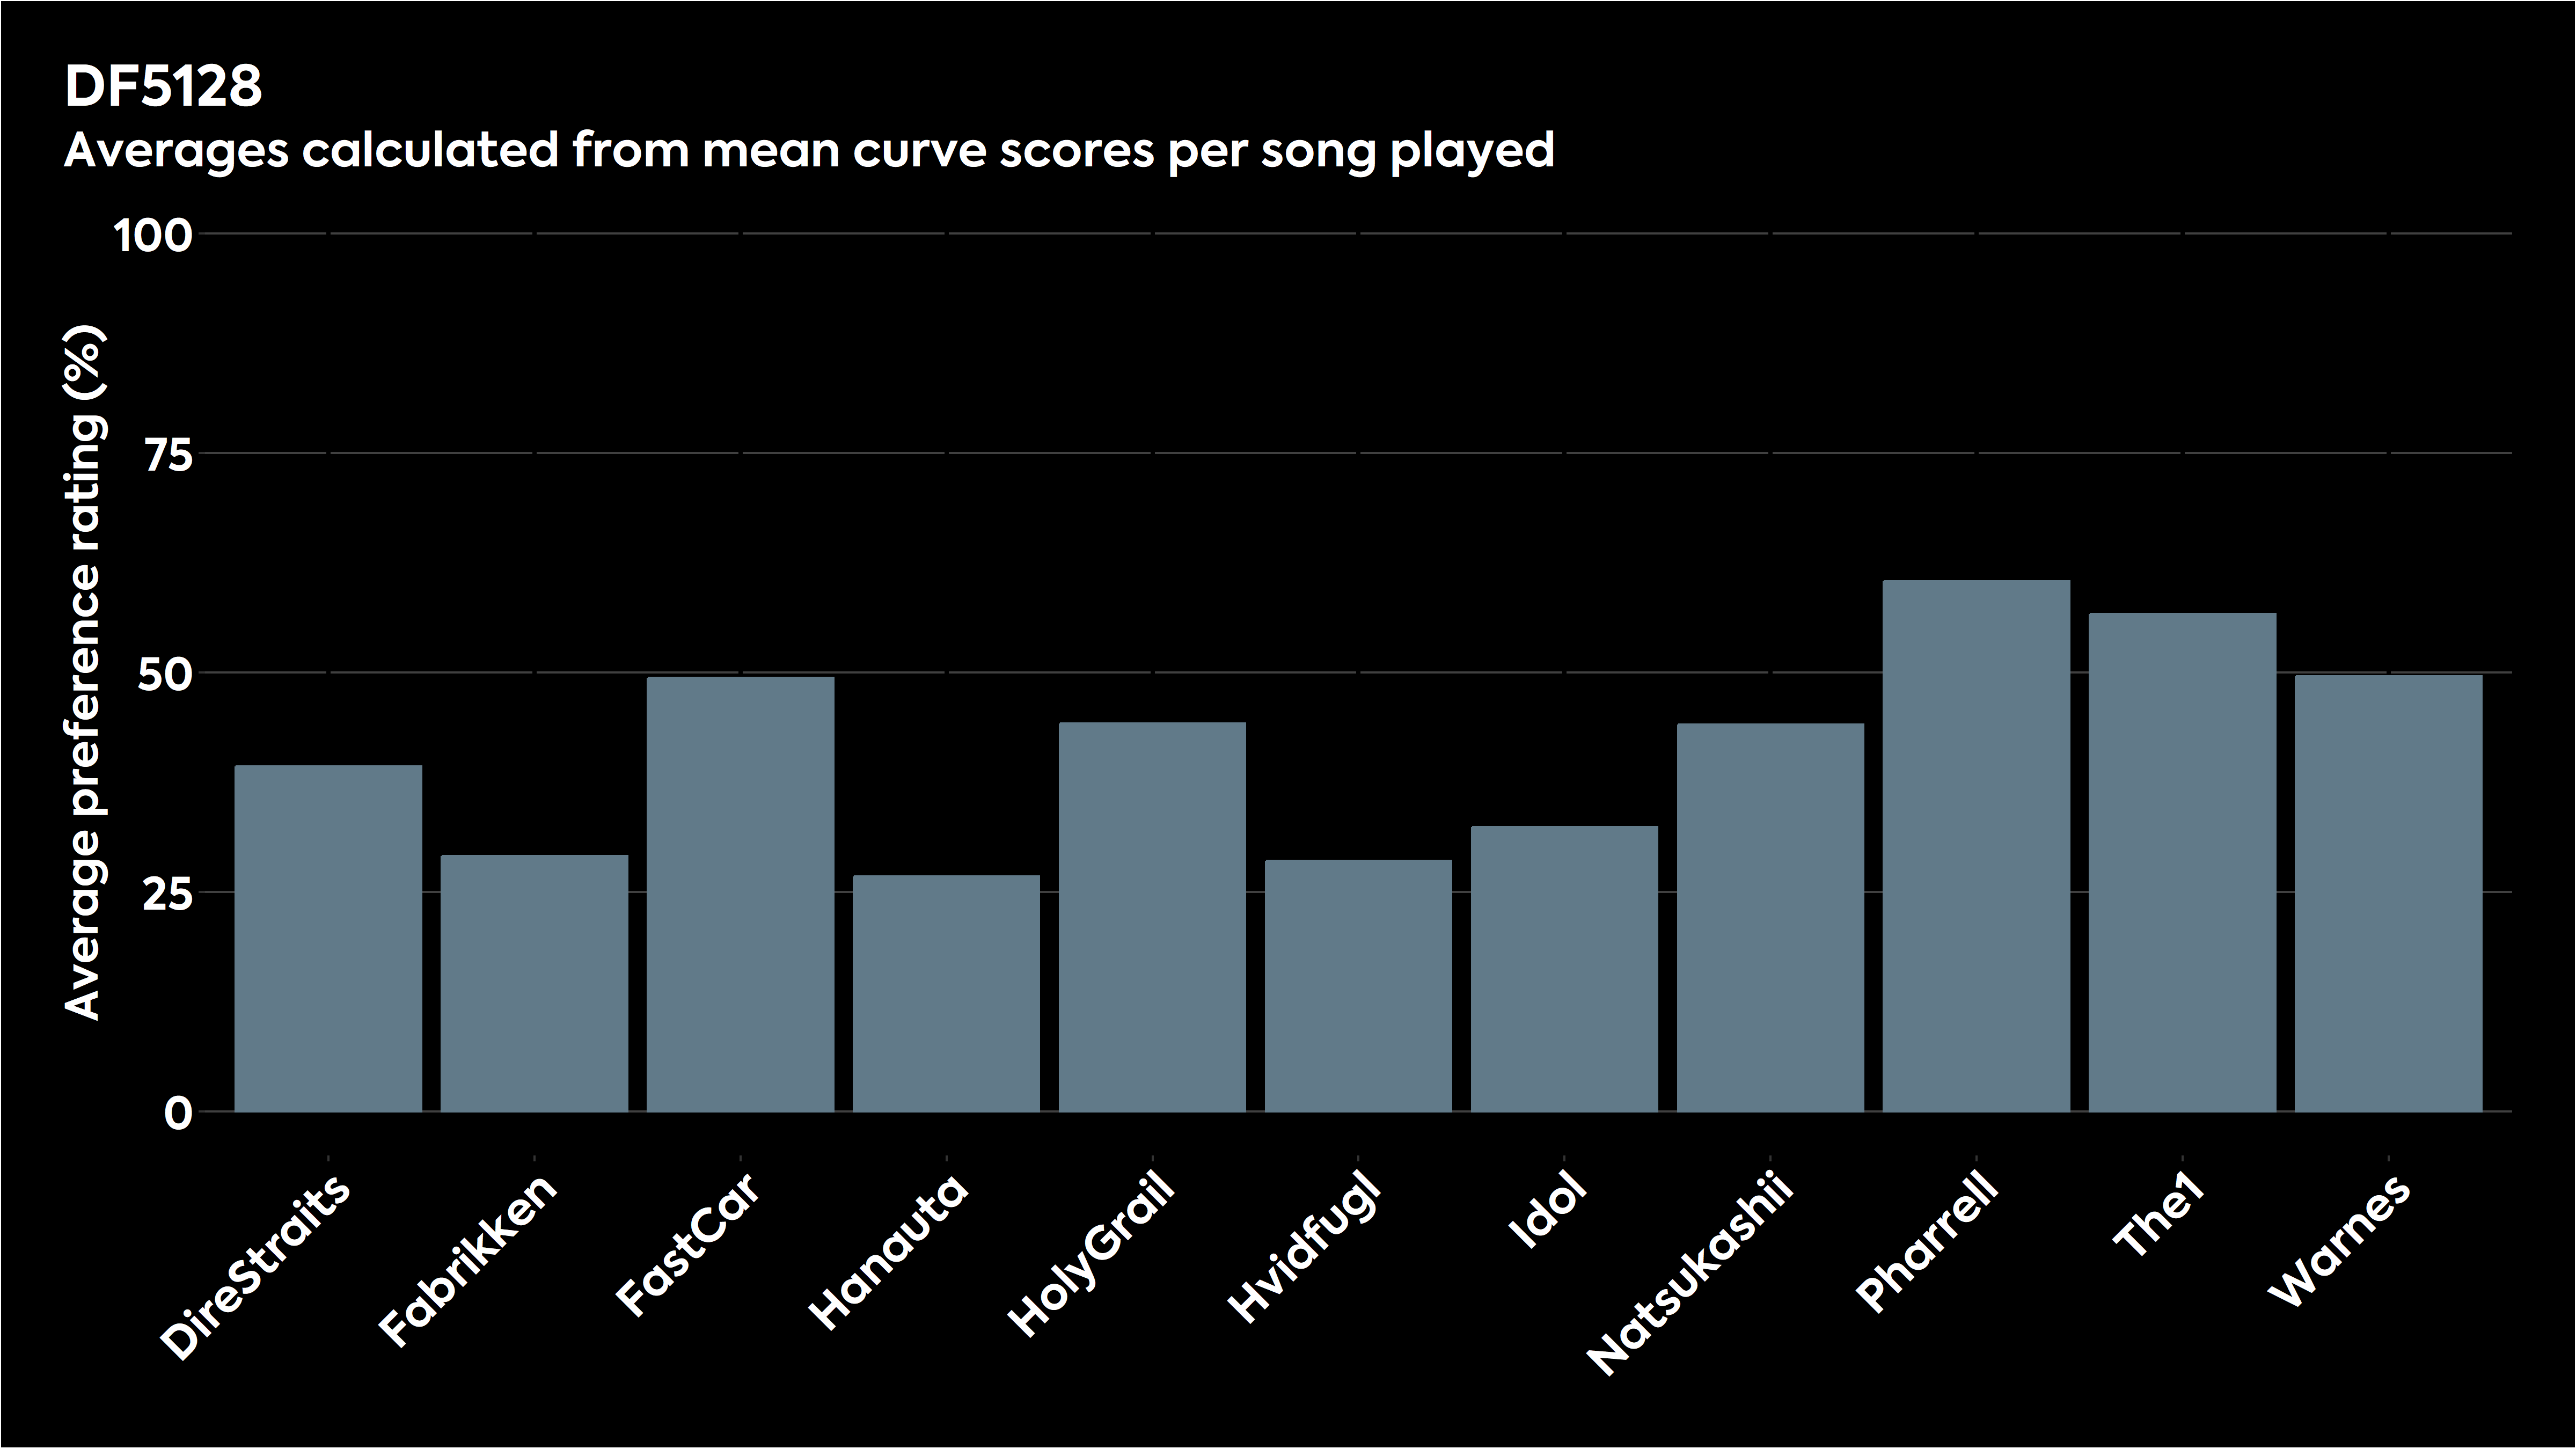
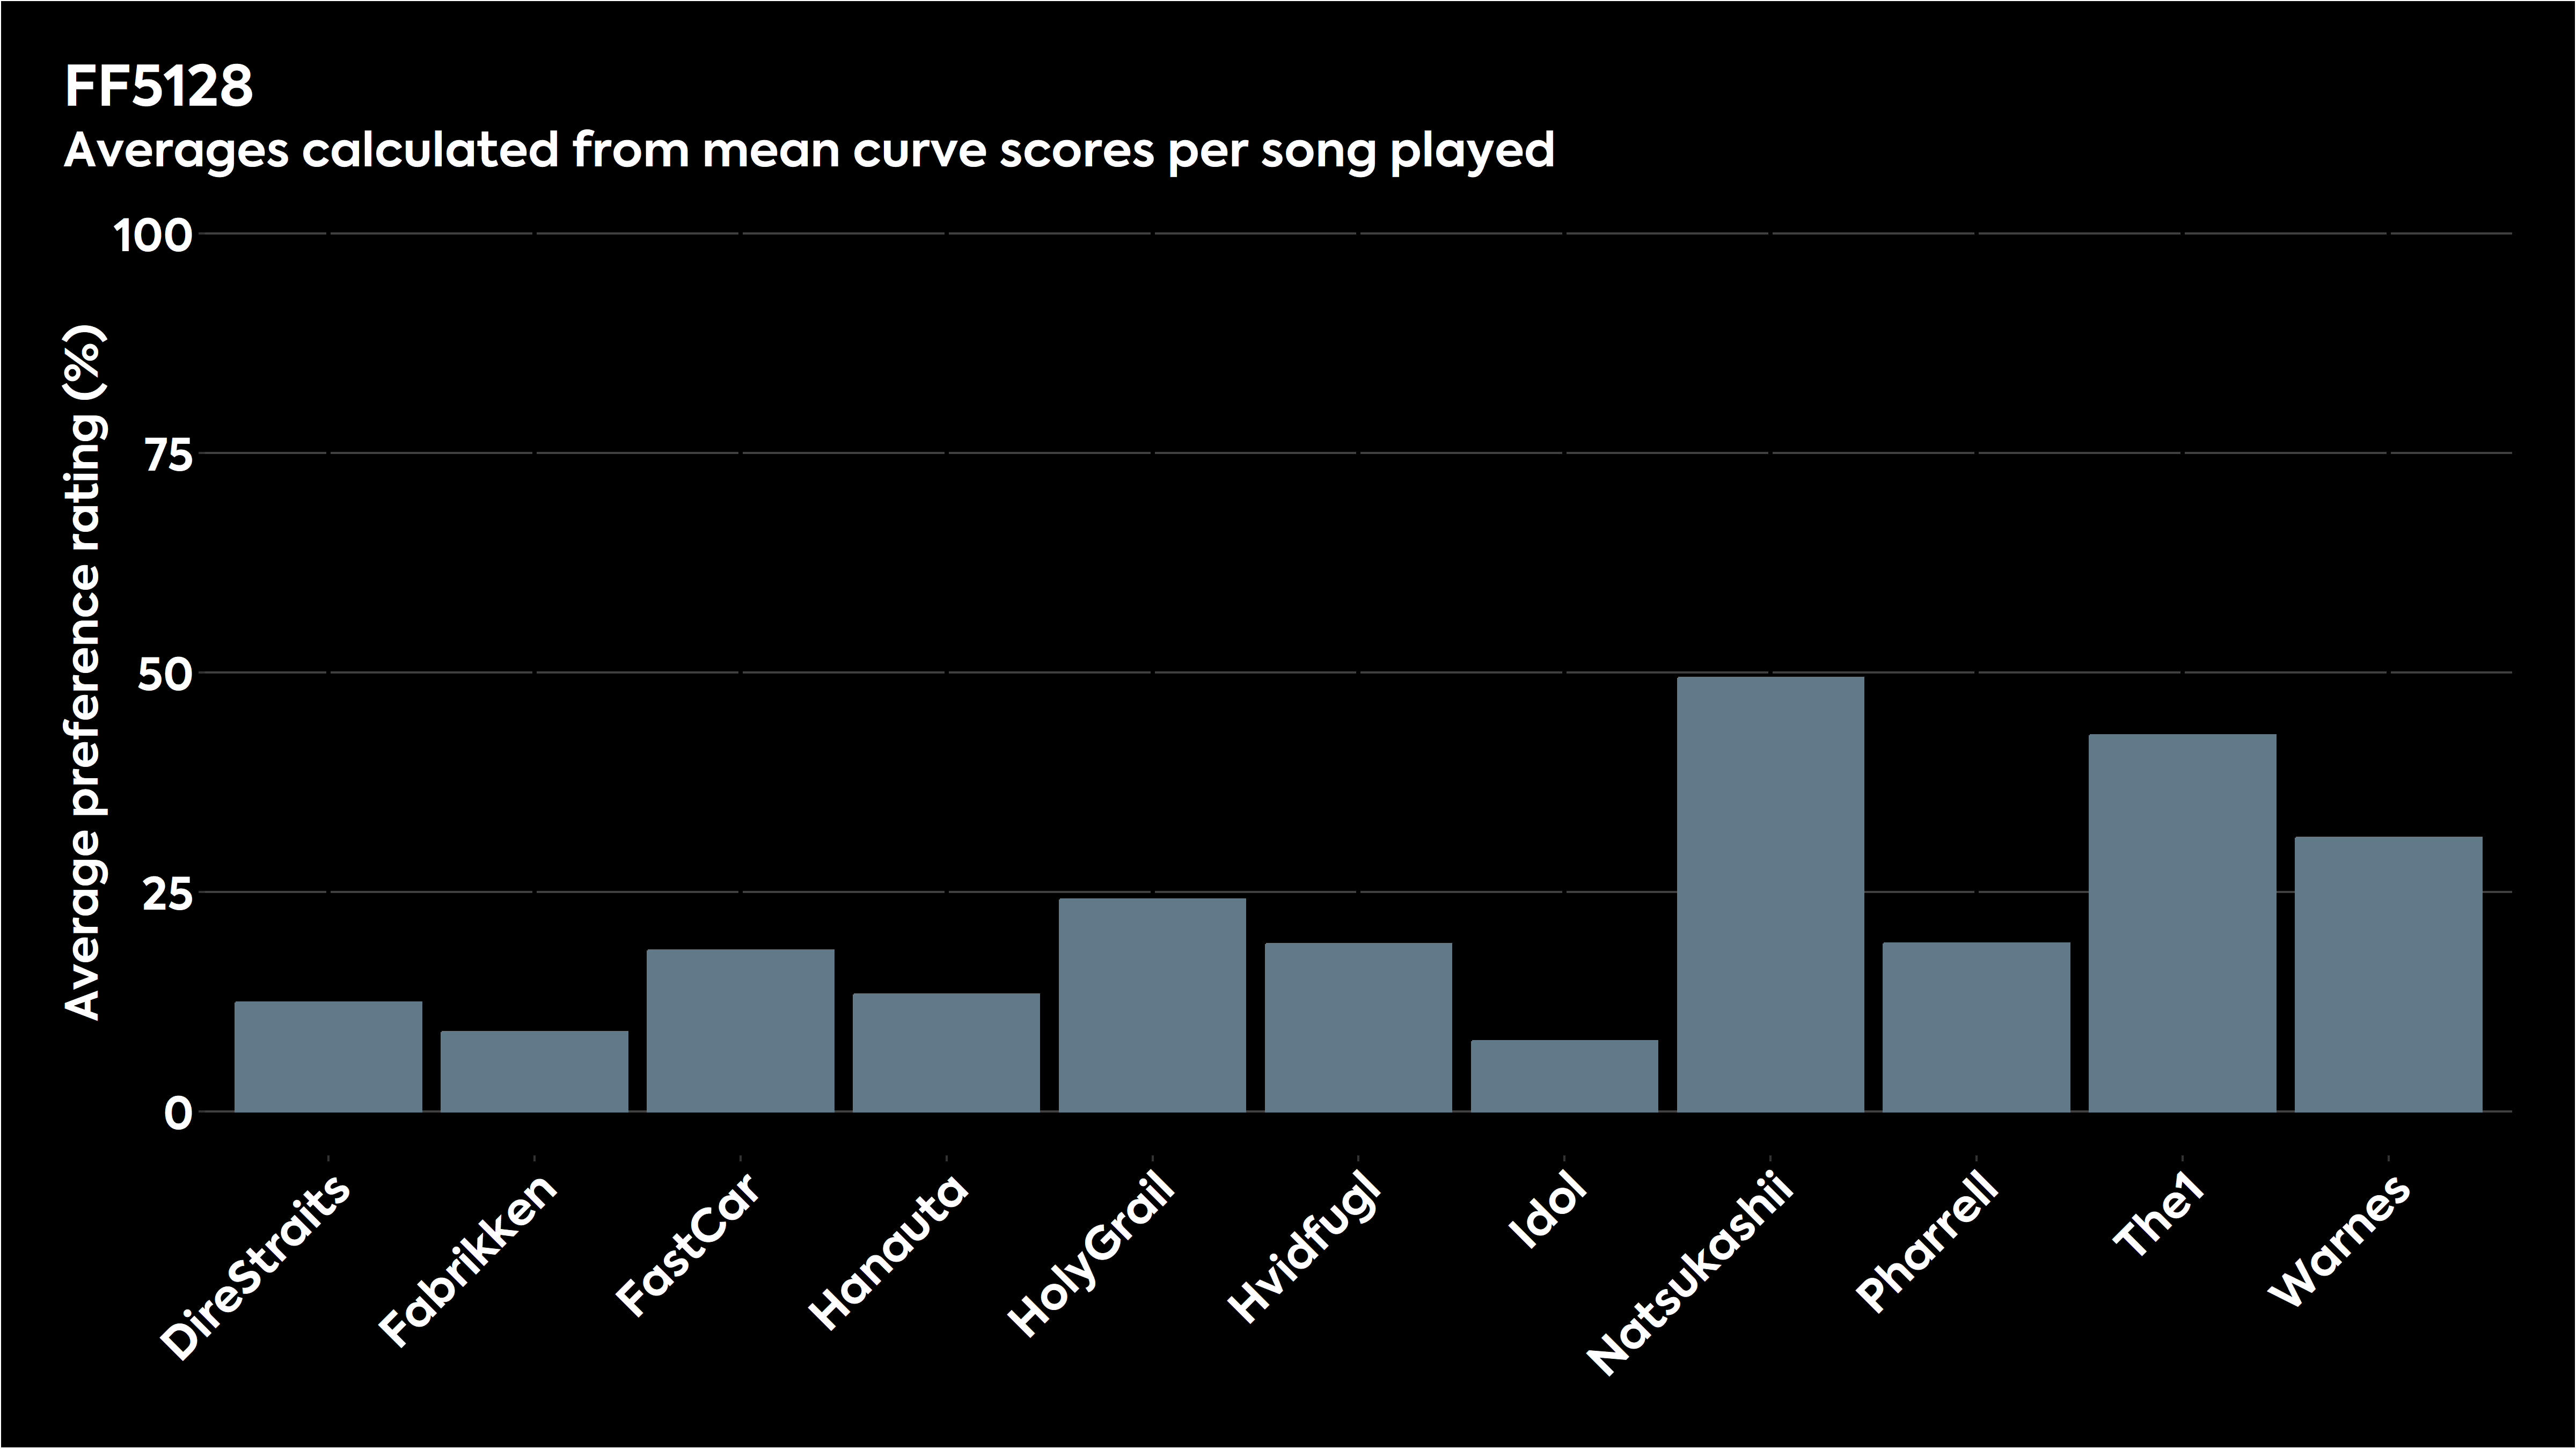
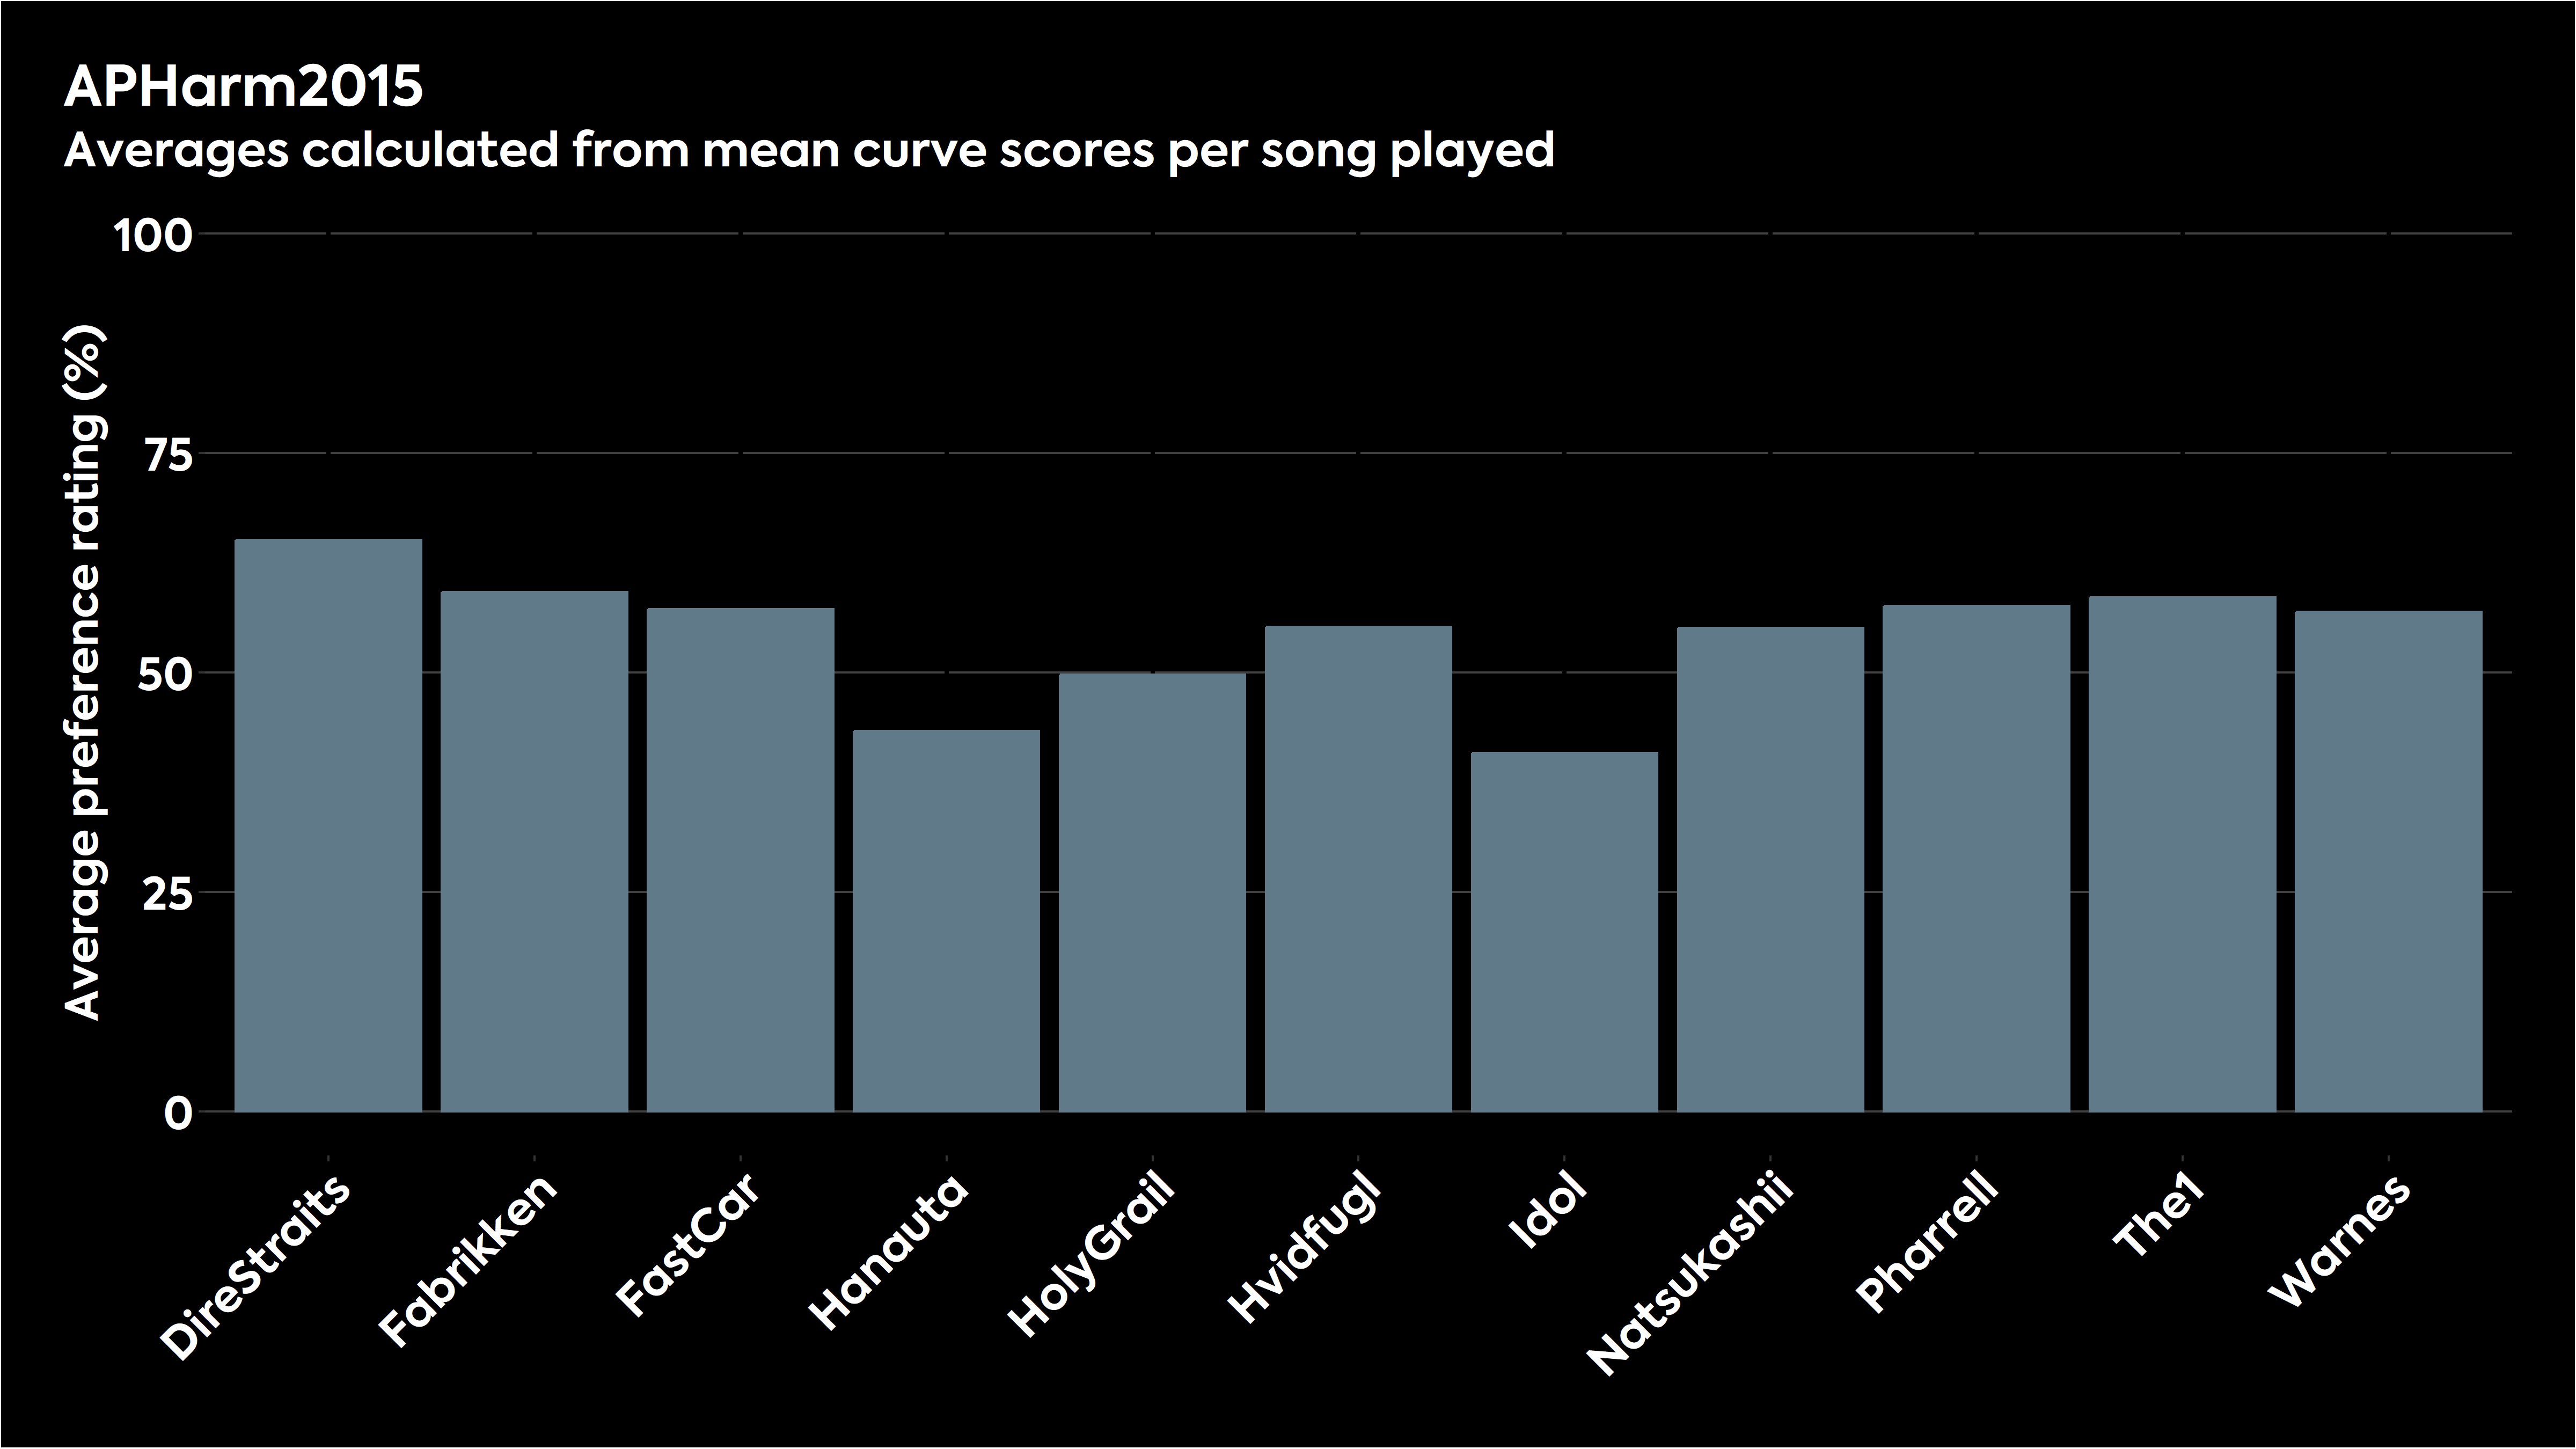
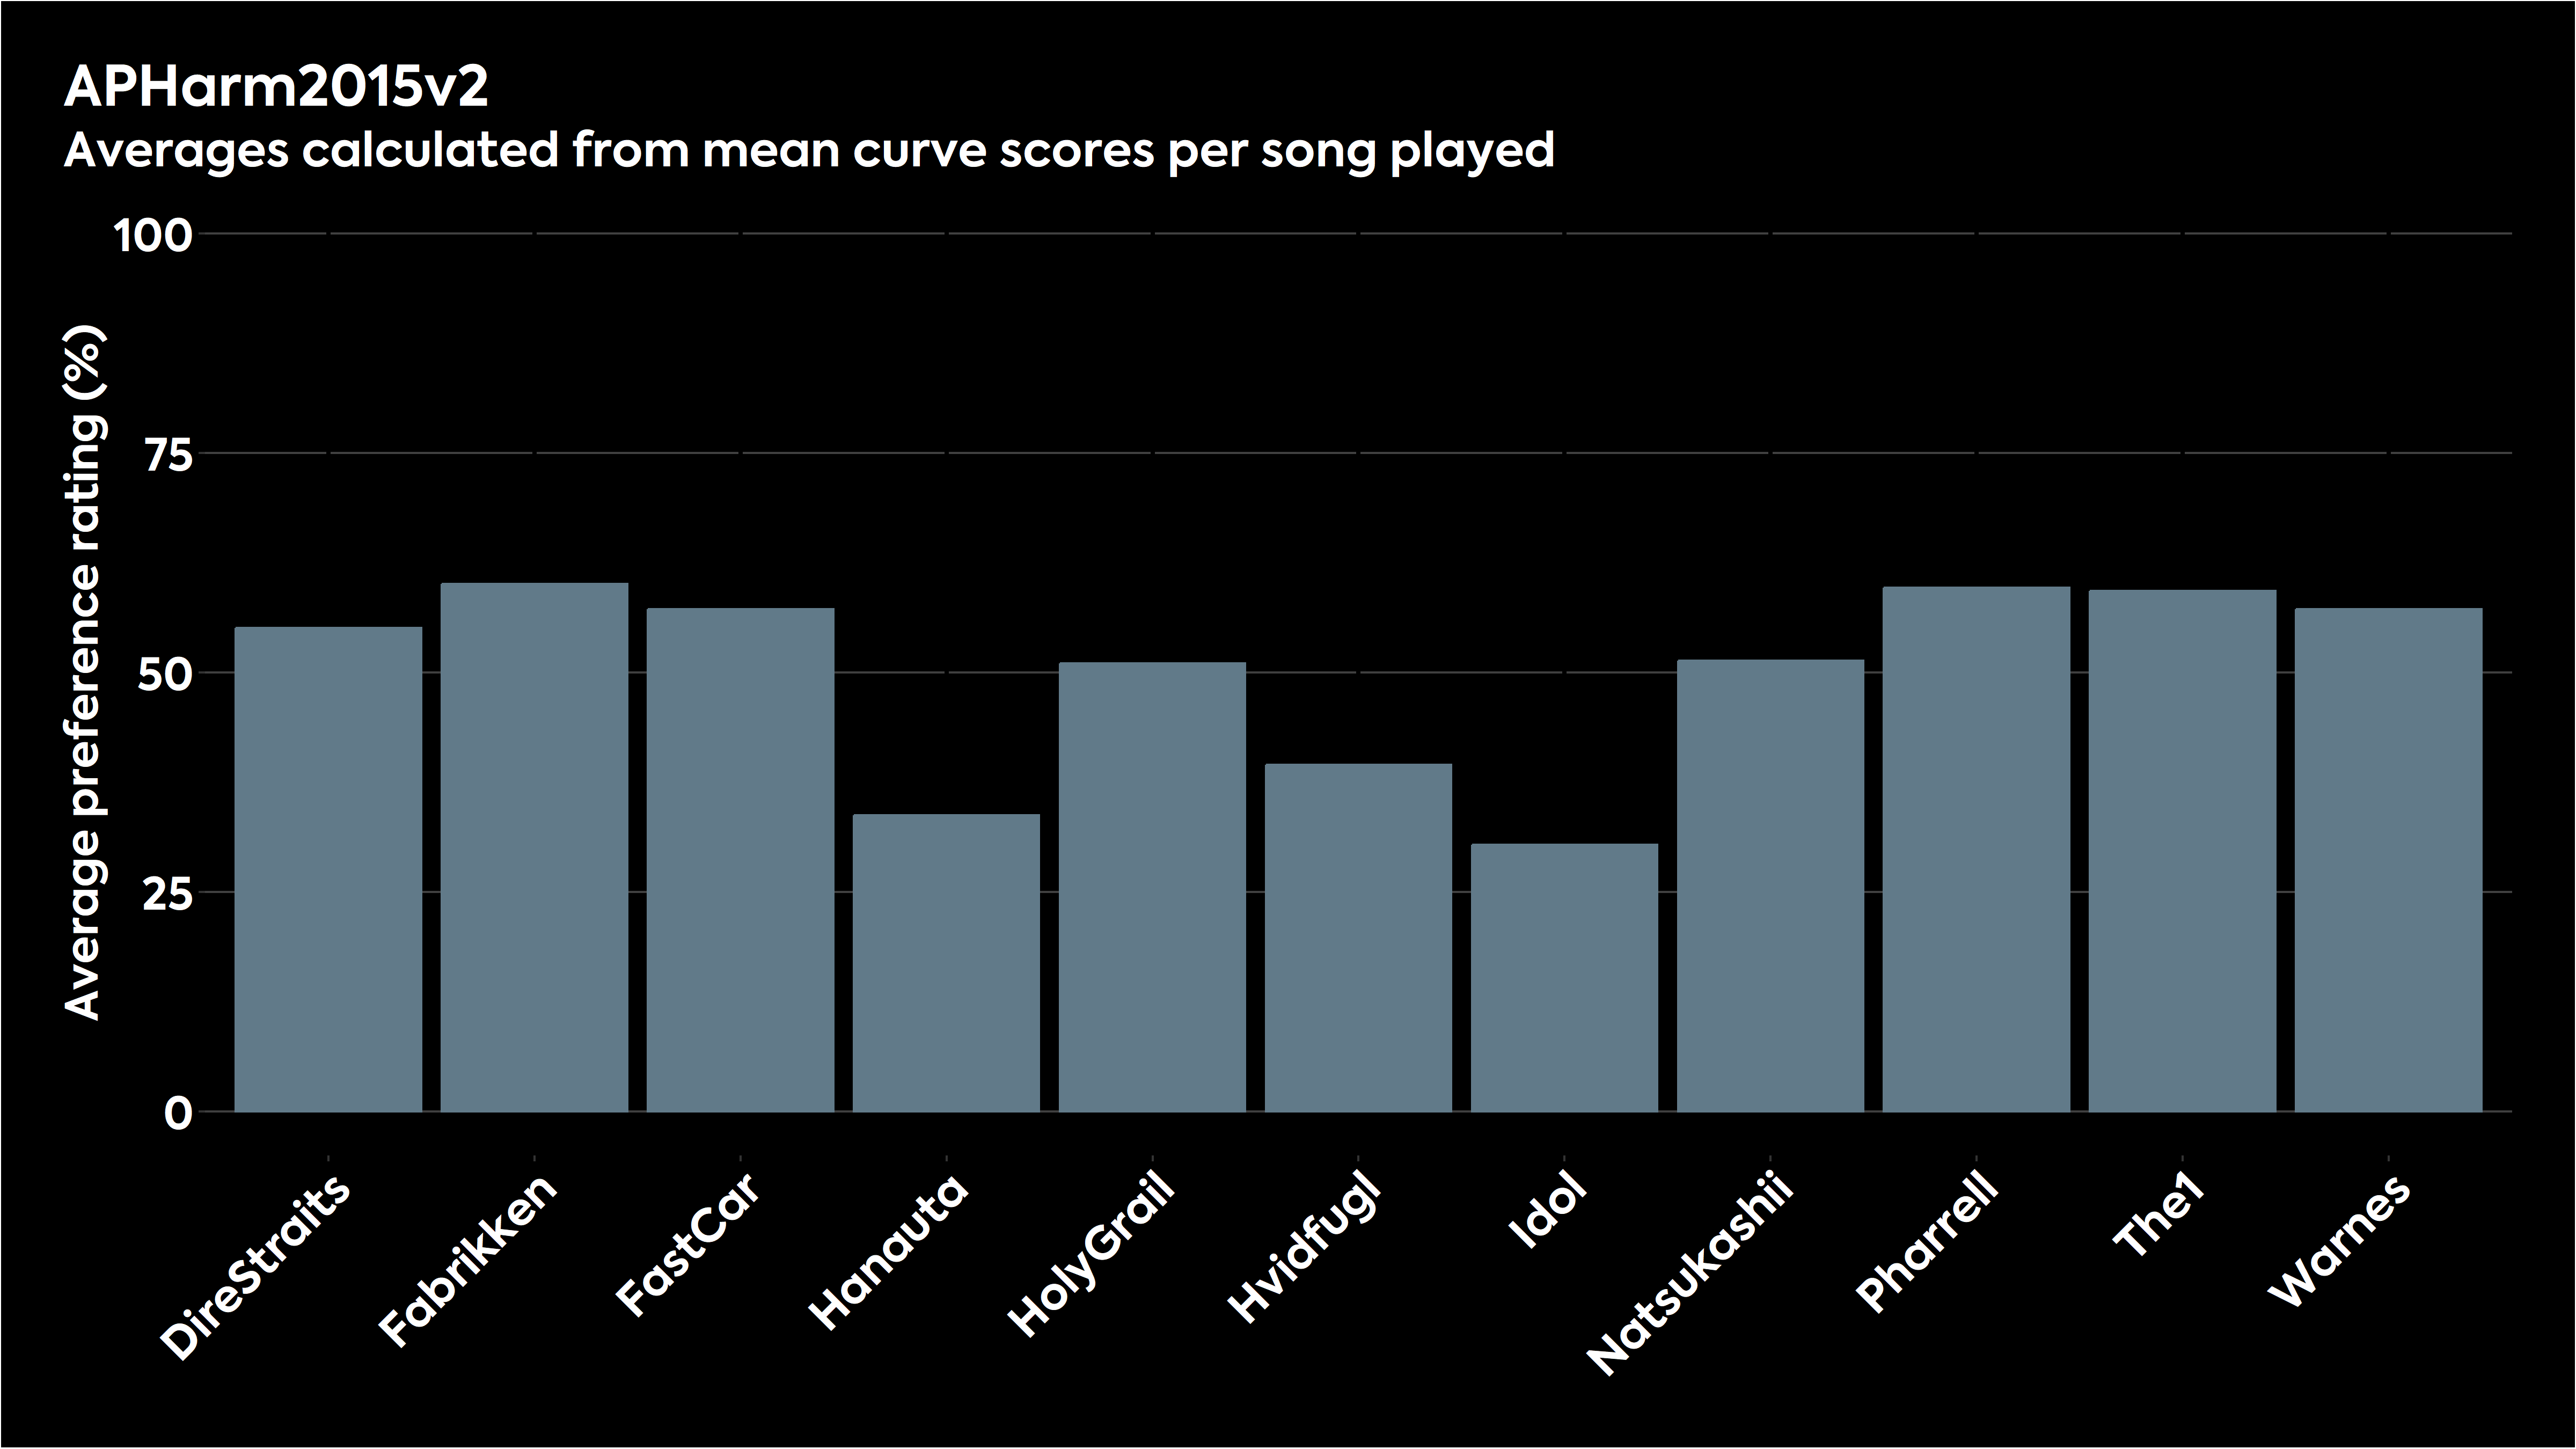
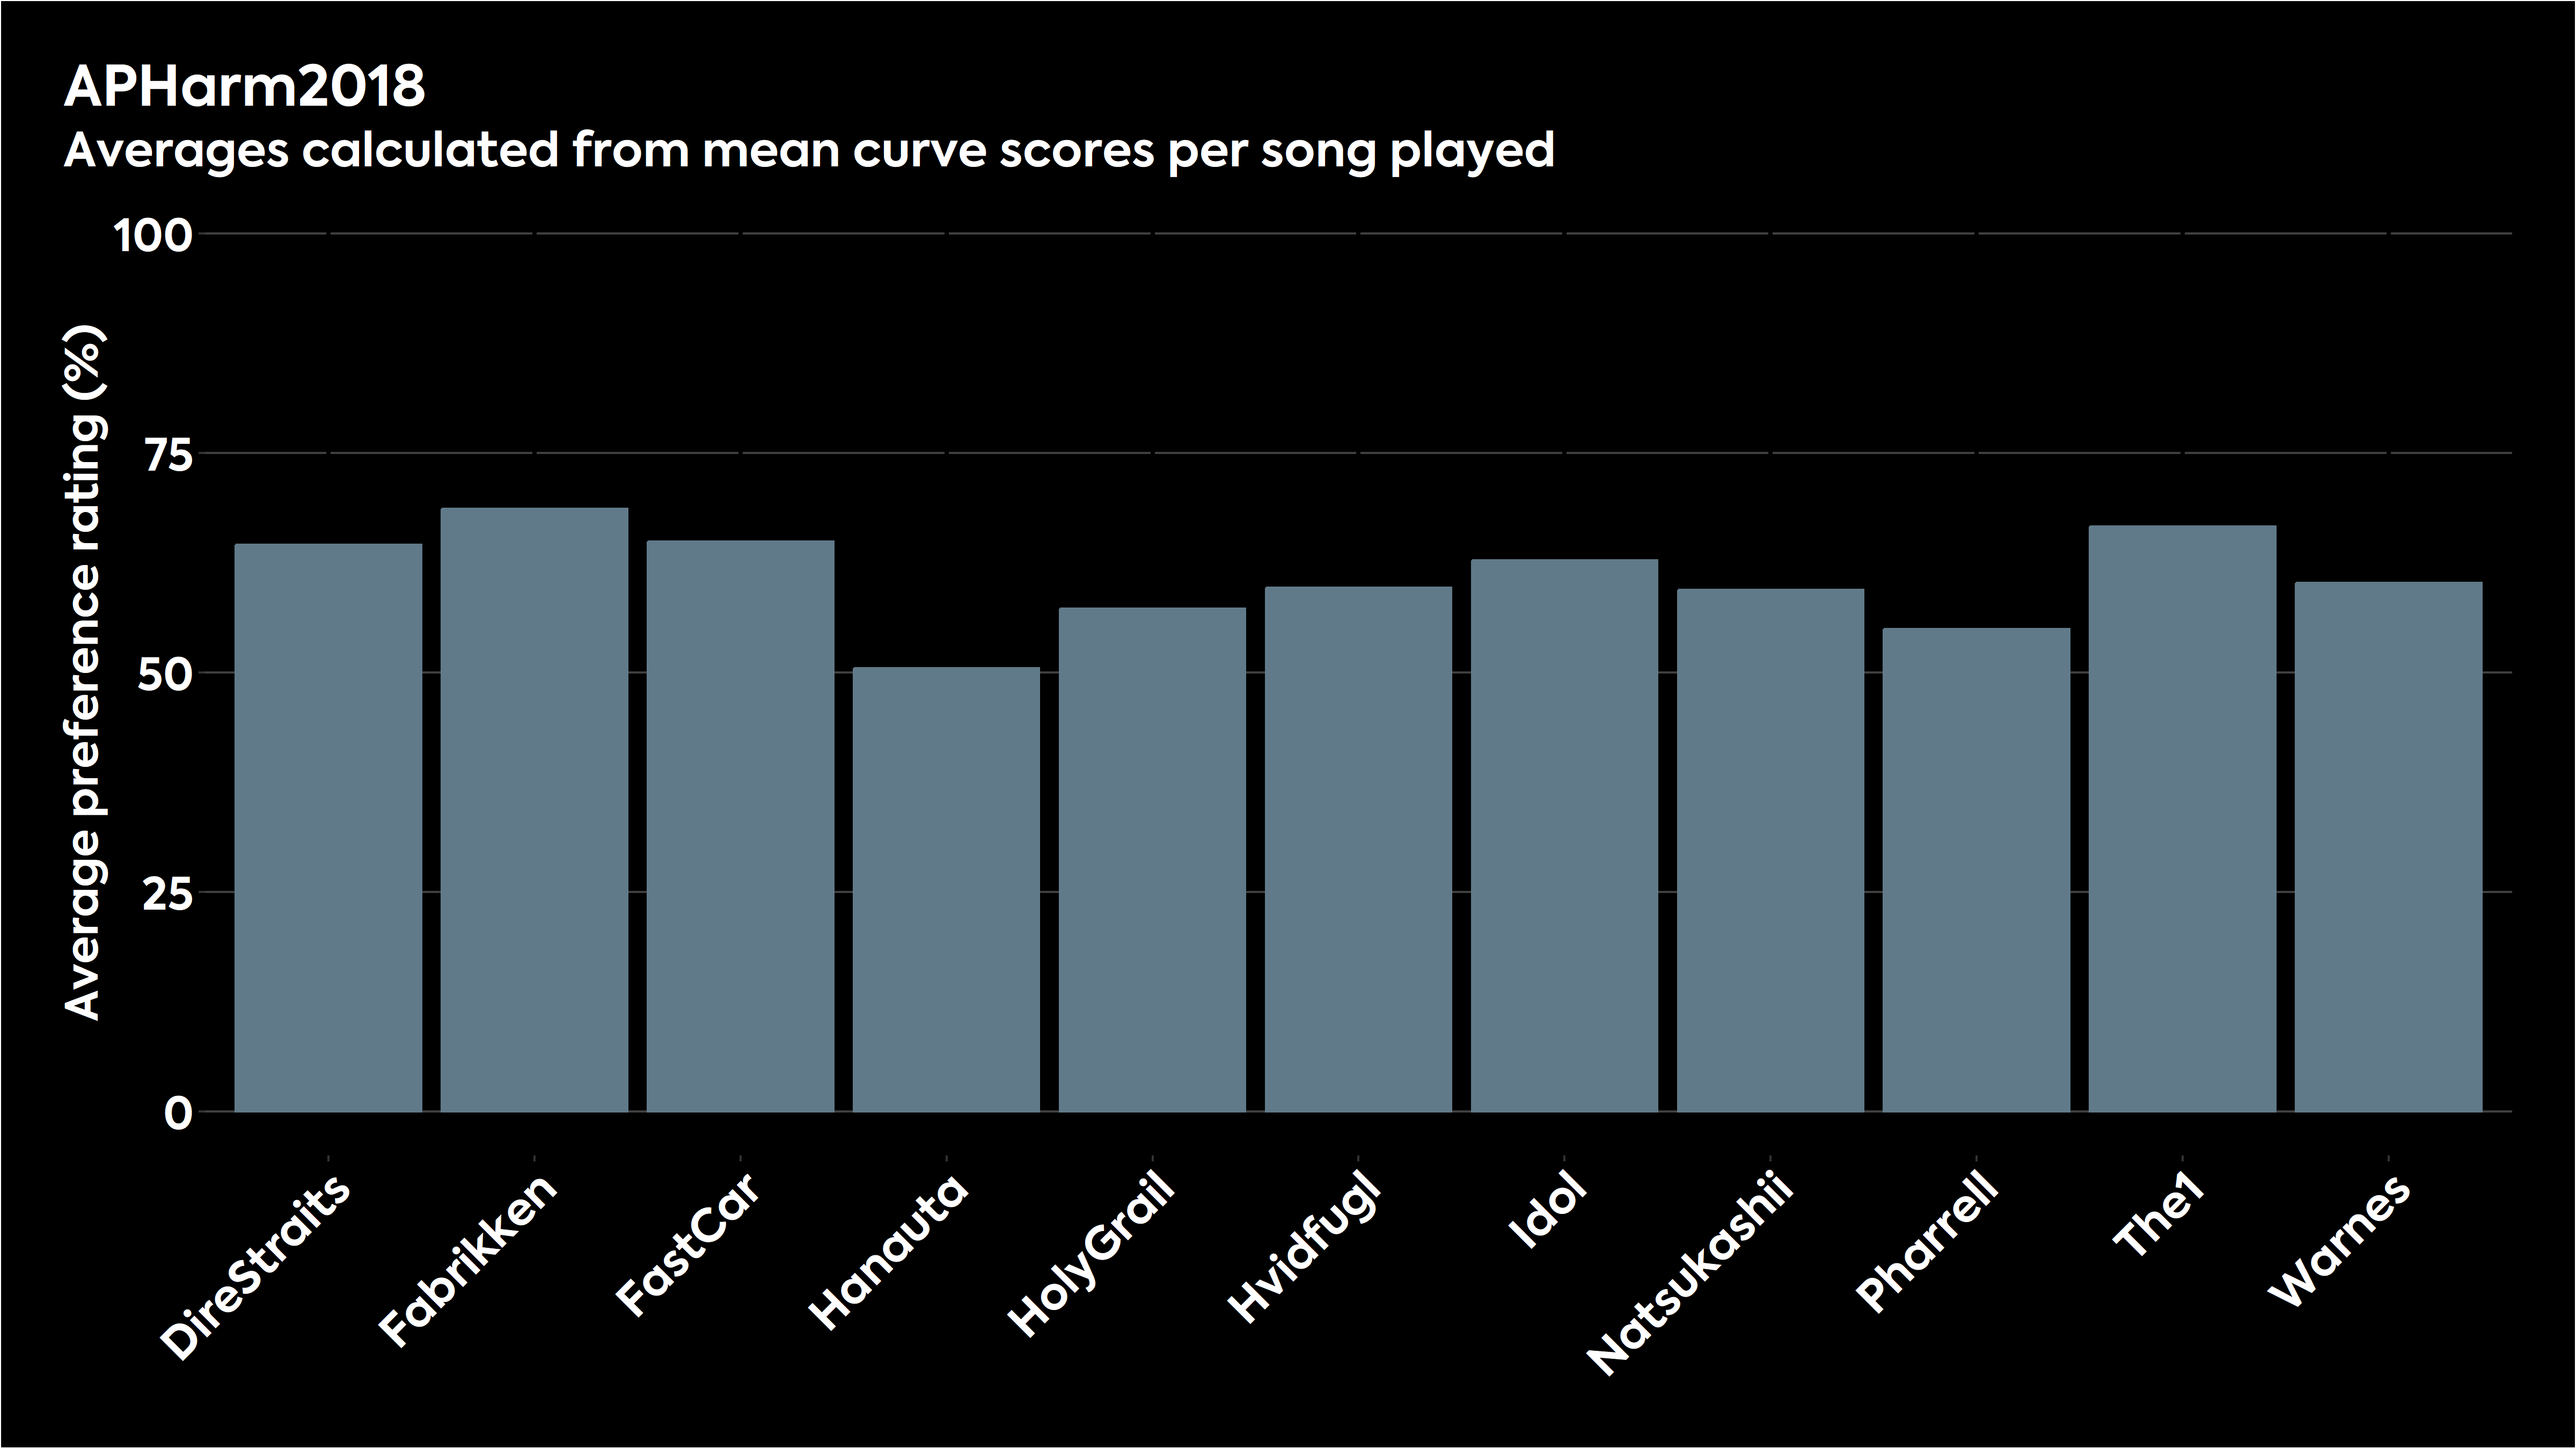
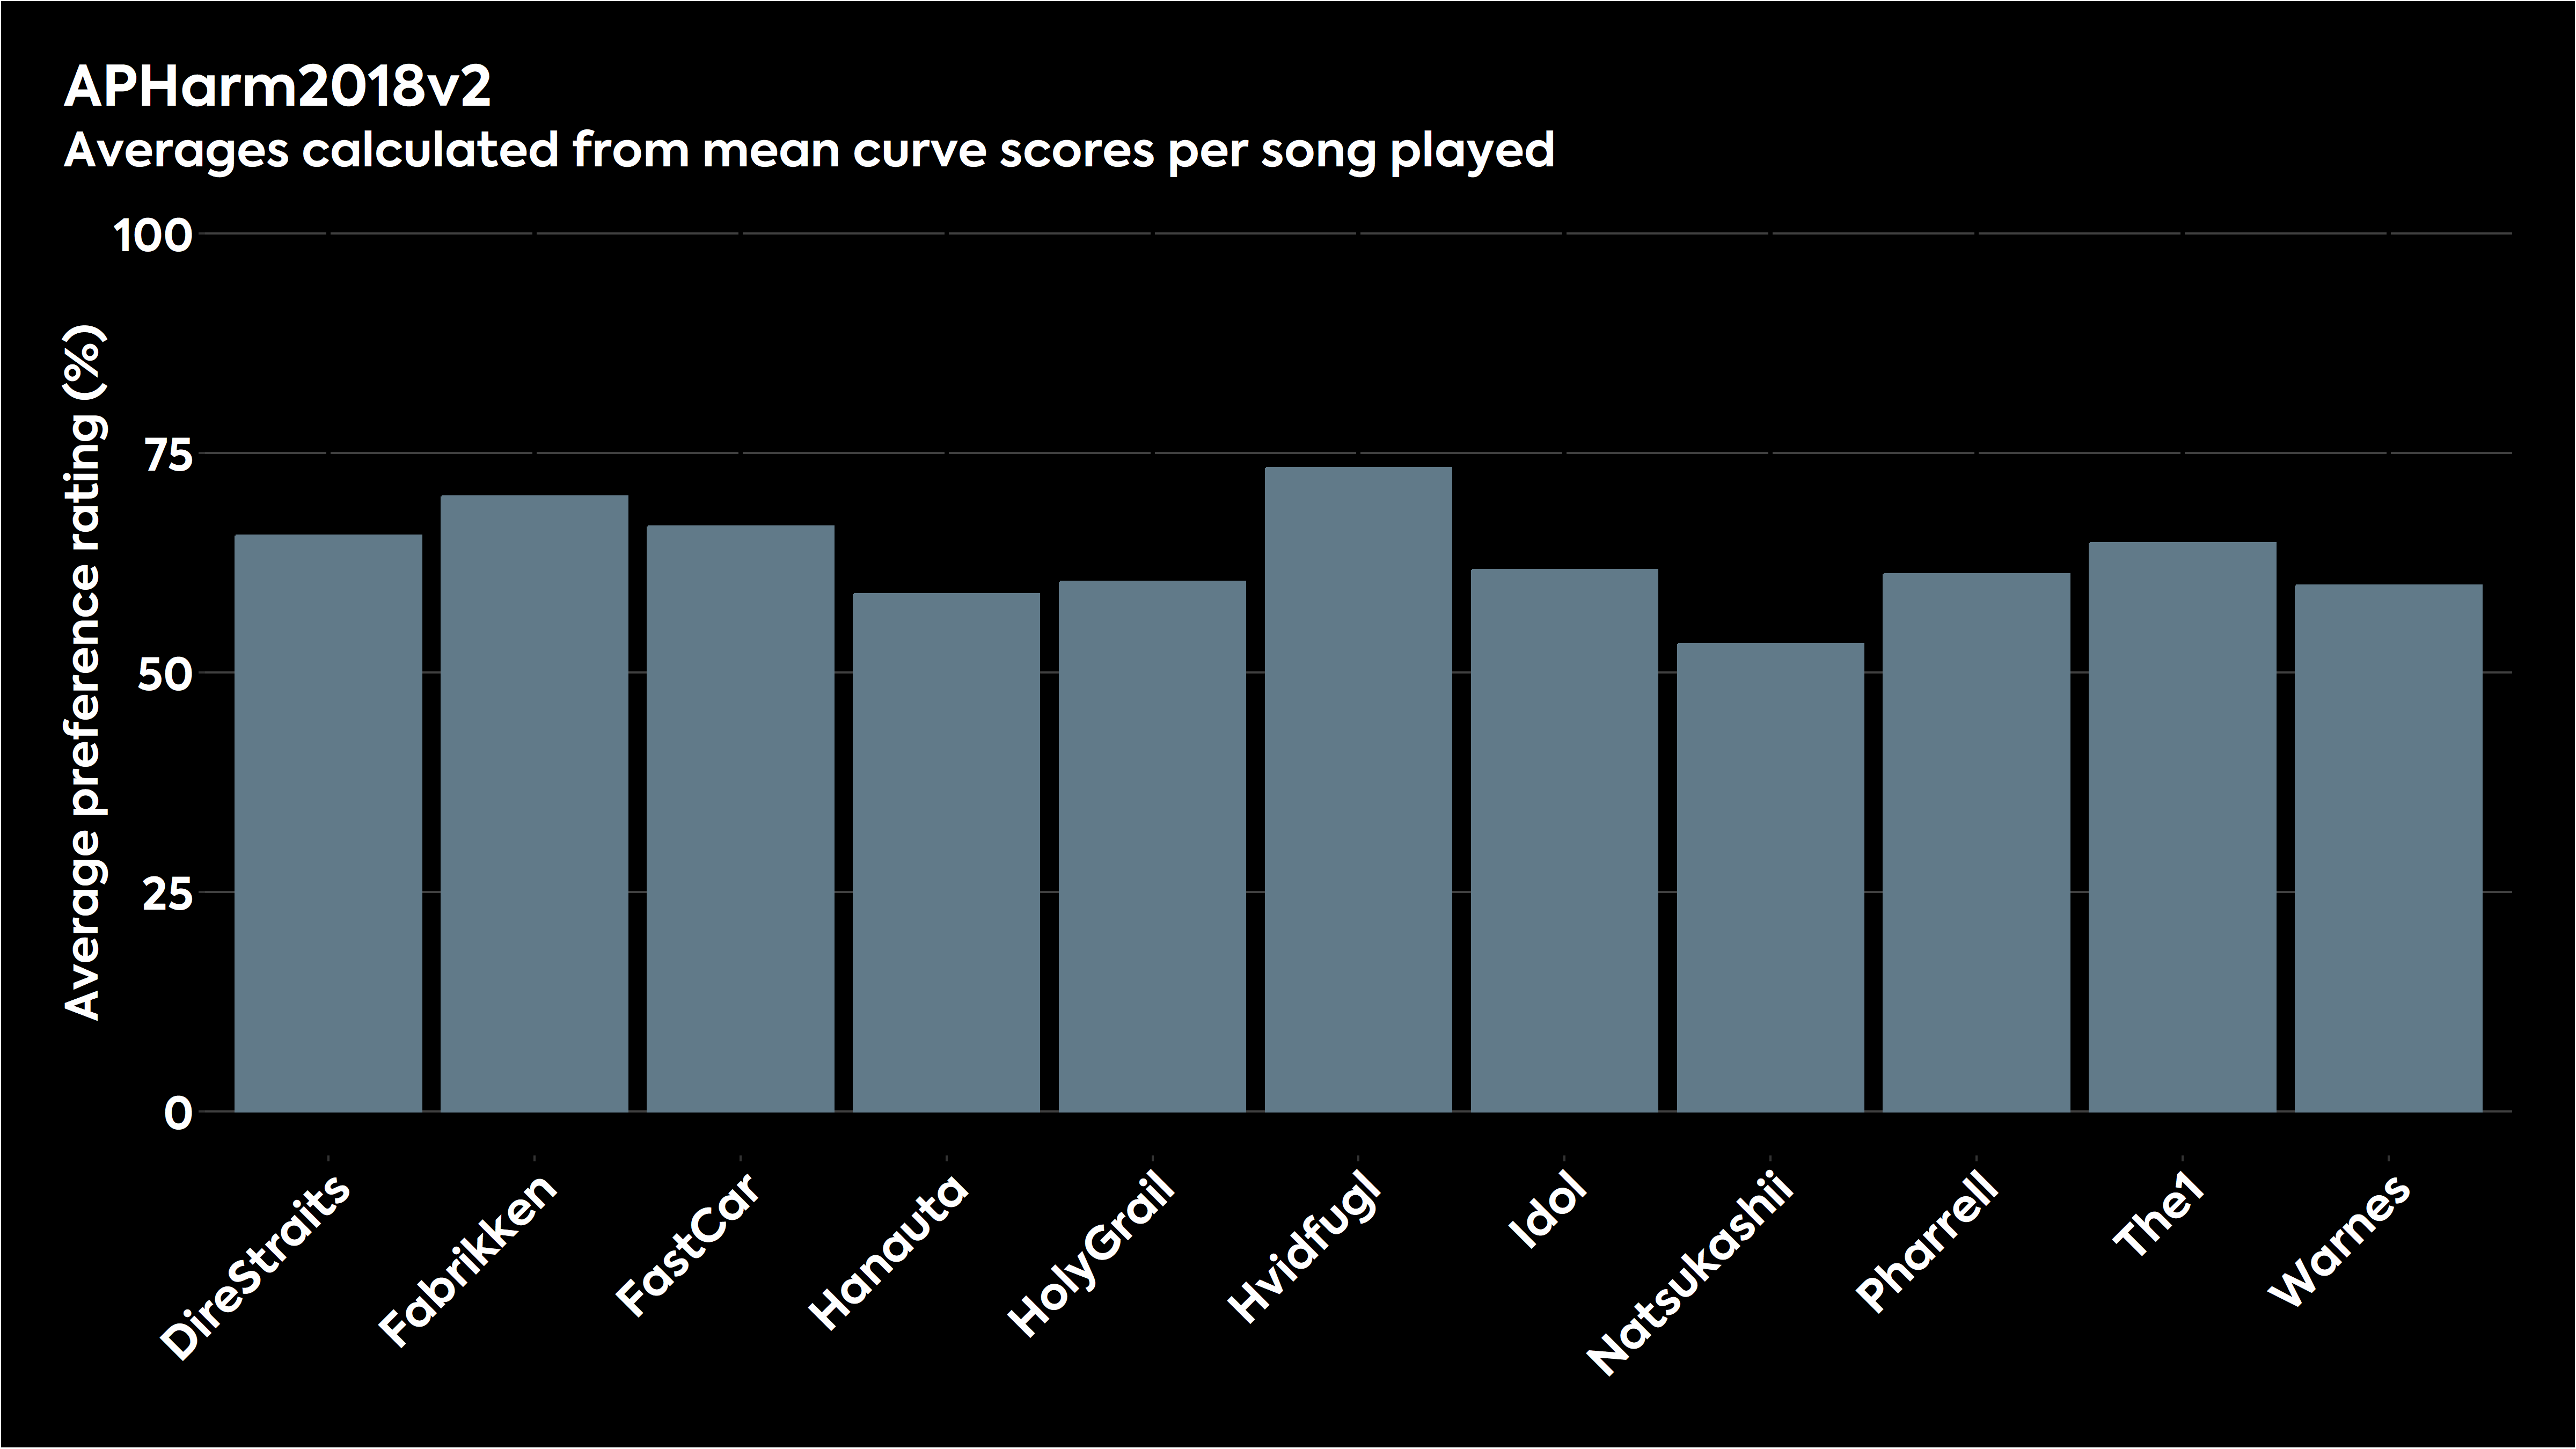
As you can see from the above chart, the listeners liked some of the music extracts presented with the SoundGuys headphone preference curve more than others. This is somewhat expected. It seems that Hanauta, a Japan-only track, was particularly unfavorable for some reason. This reinforces the notion that different headphone responses can work better for different musical styles, genres, and vintages due primarily to differences in mastering.
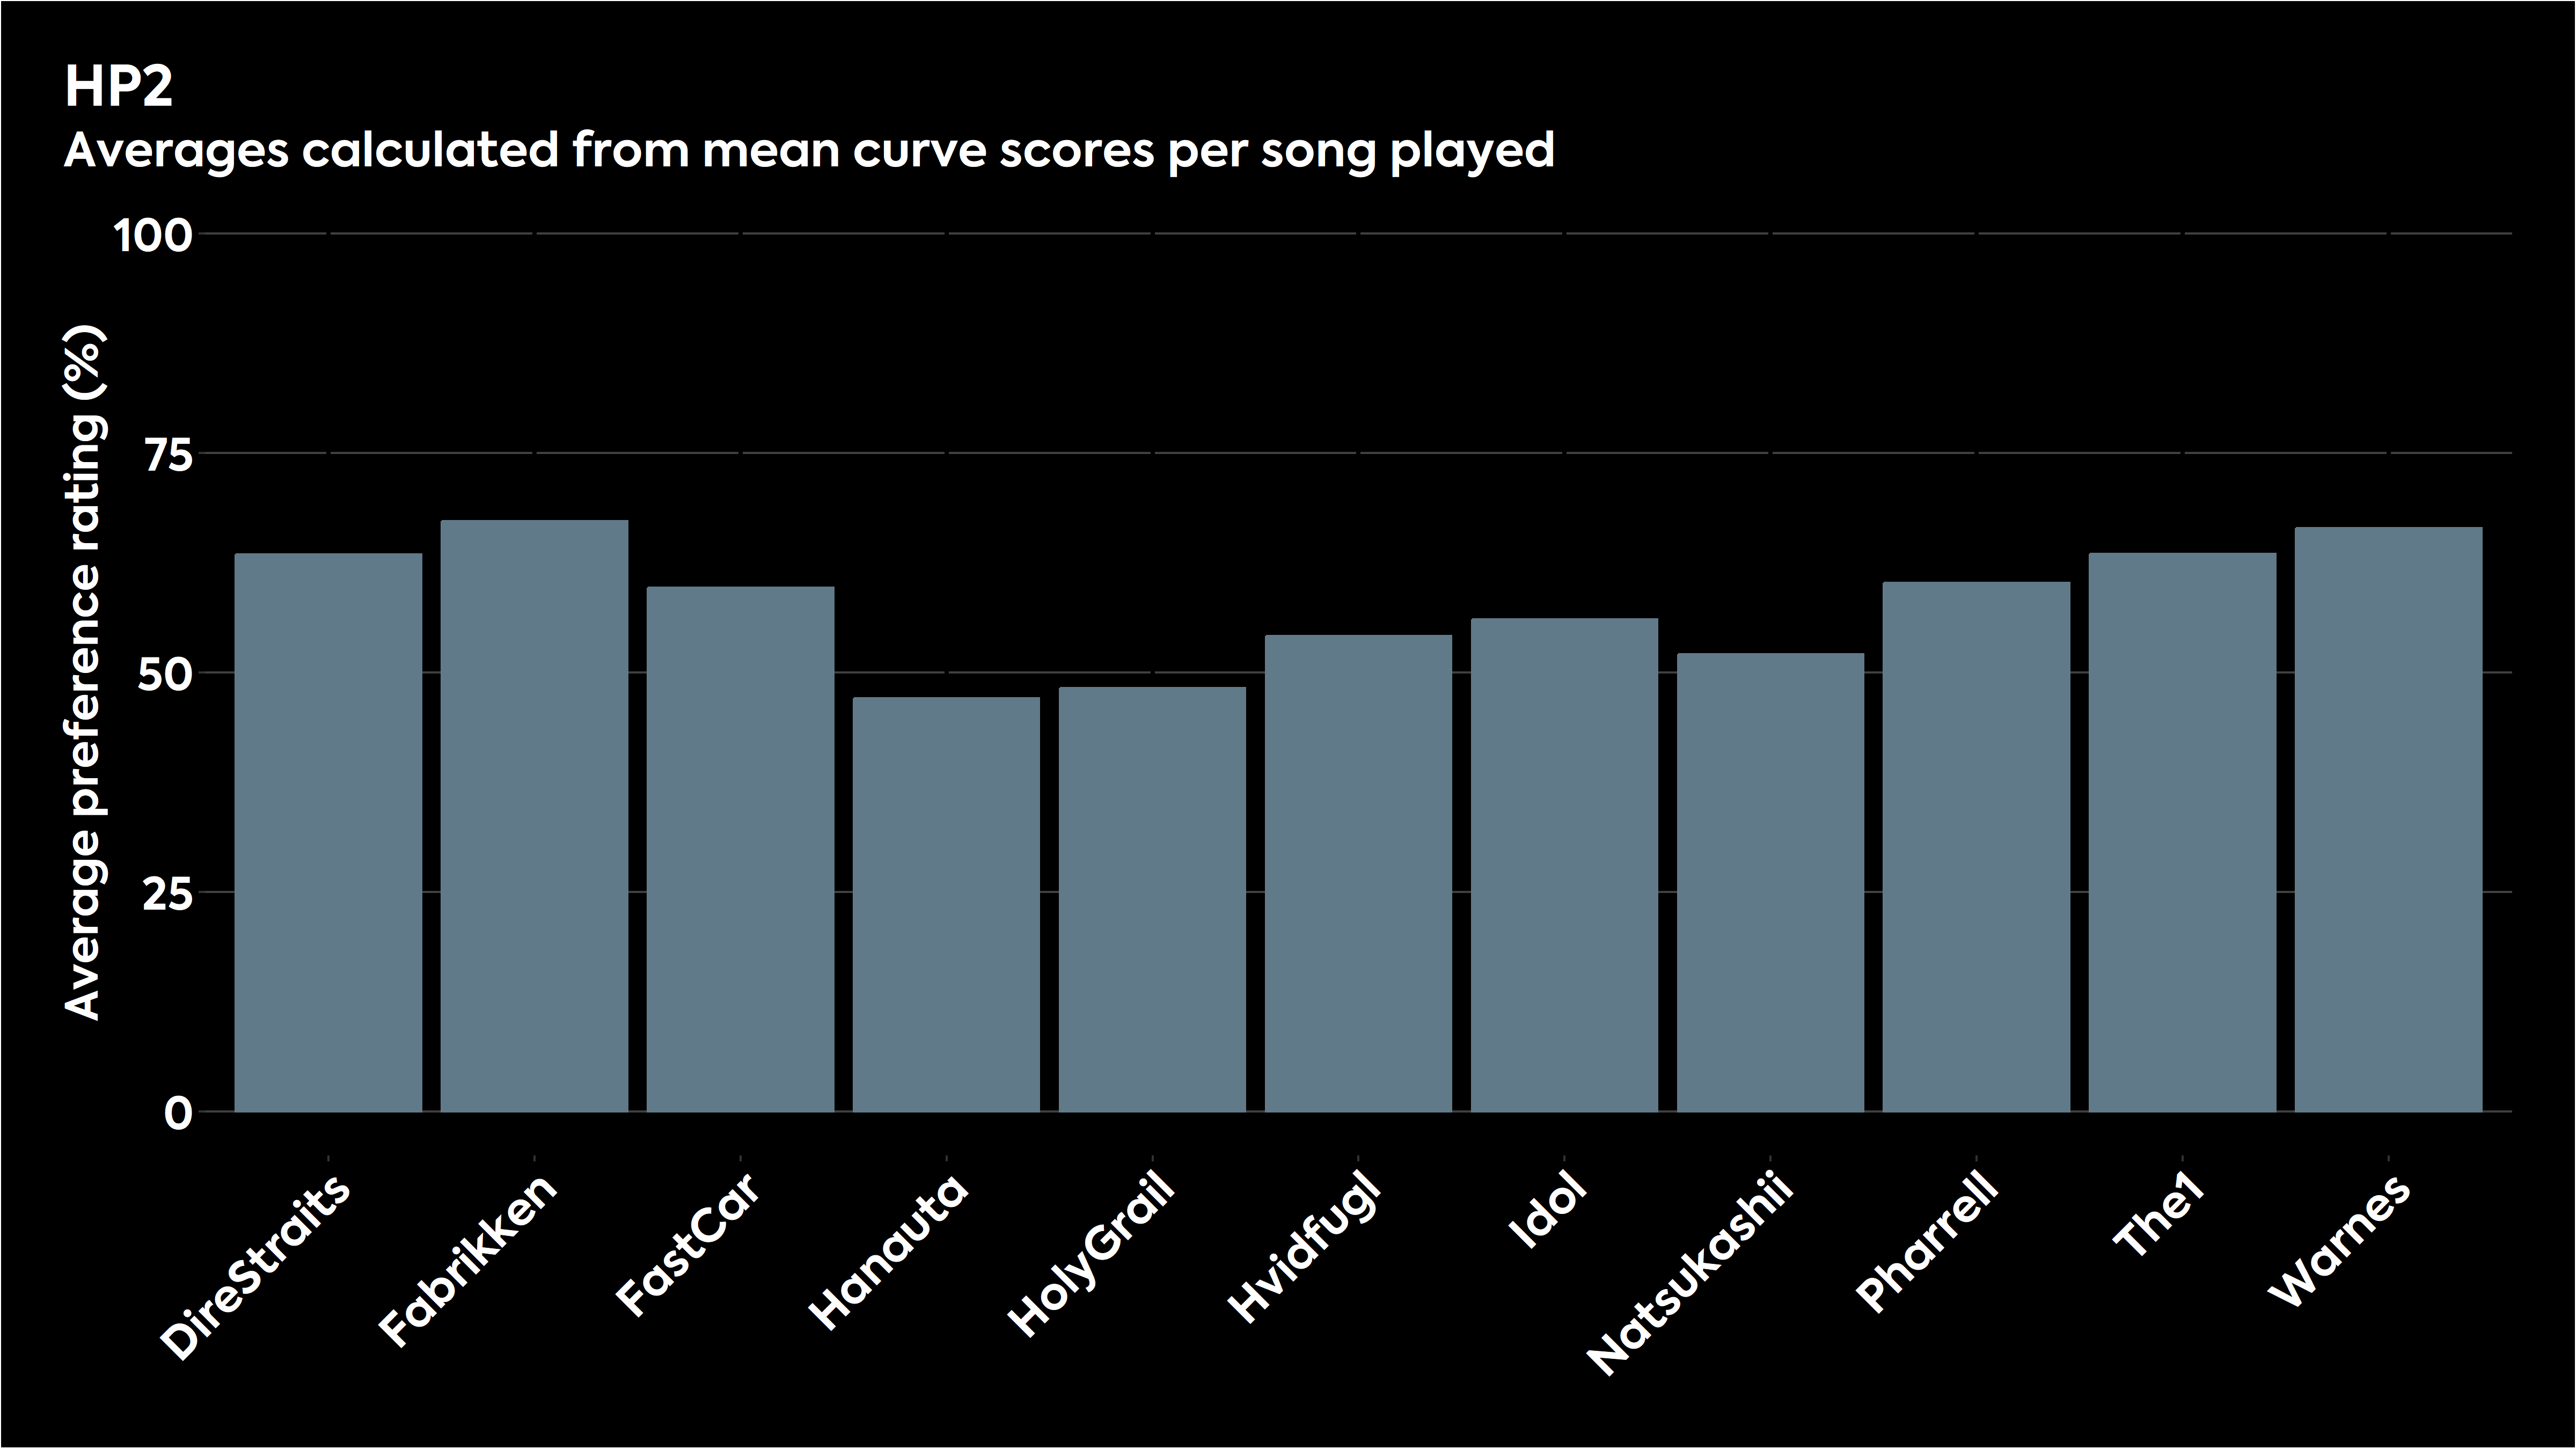
Some frequency responses elicited markedly different preference ratings across the different musical excerpts, while others produced more consistency across the various music styles represented by the stimulus pool. This data does a decent job of demonstrating the point that a target curve with a high preference rating doesn’t automatically mean that you’ll like it for every song.
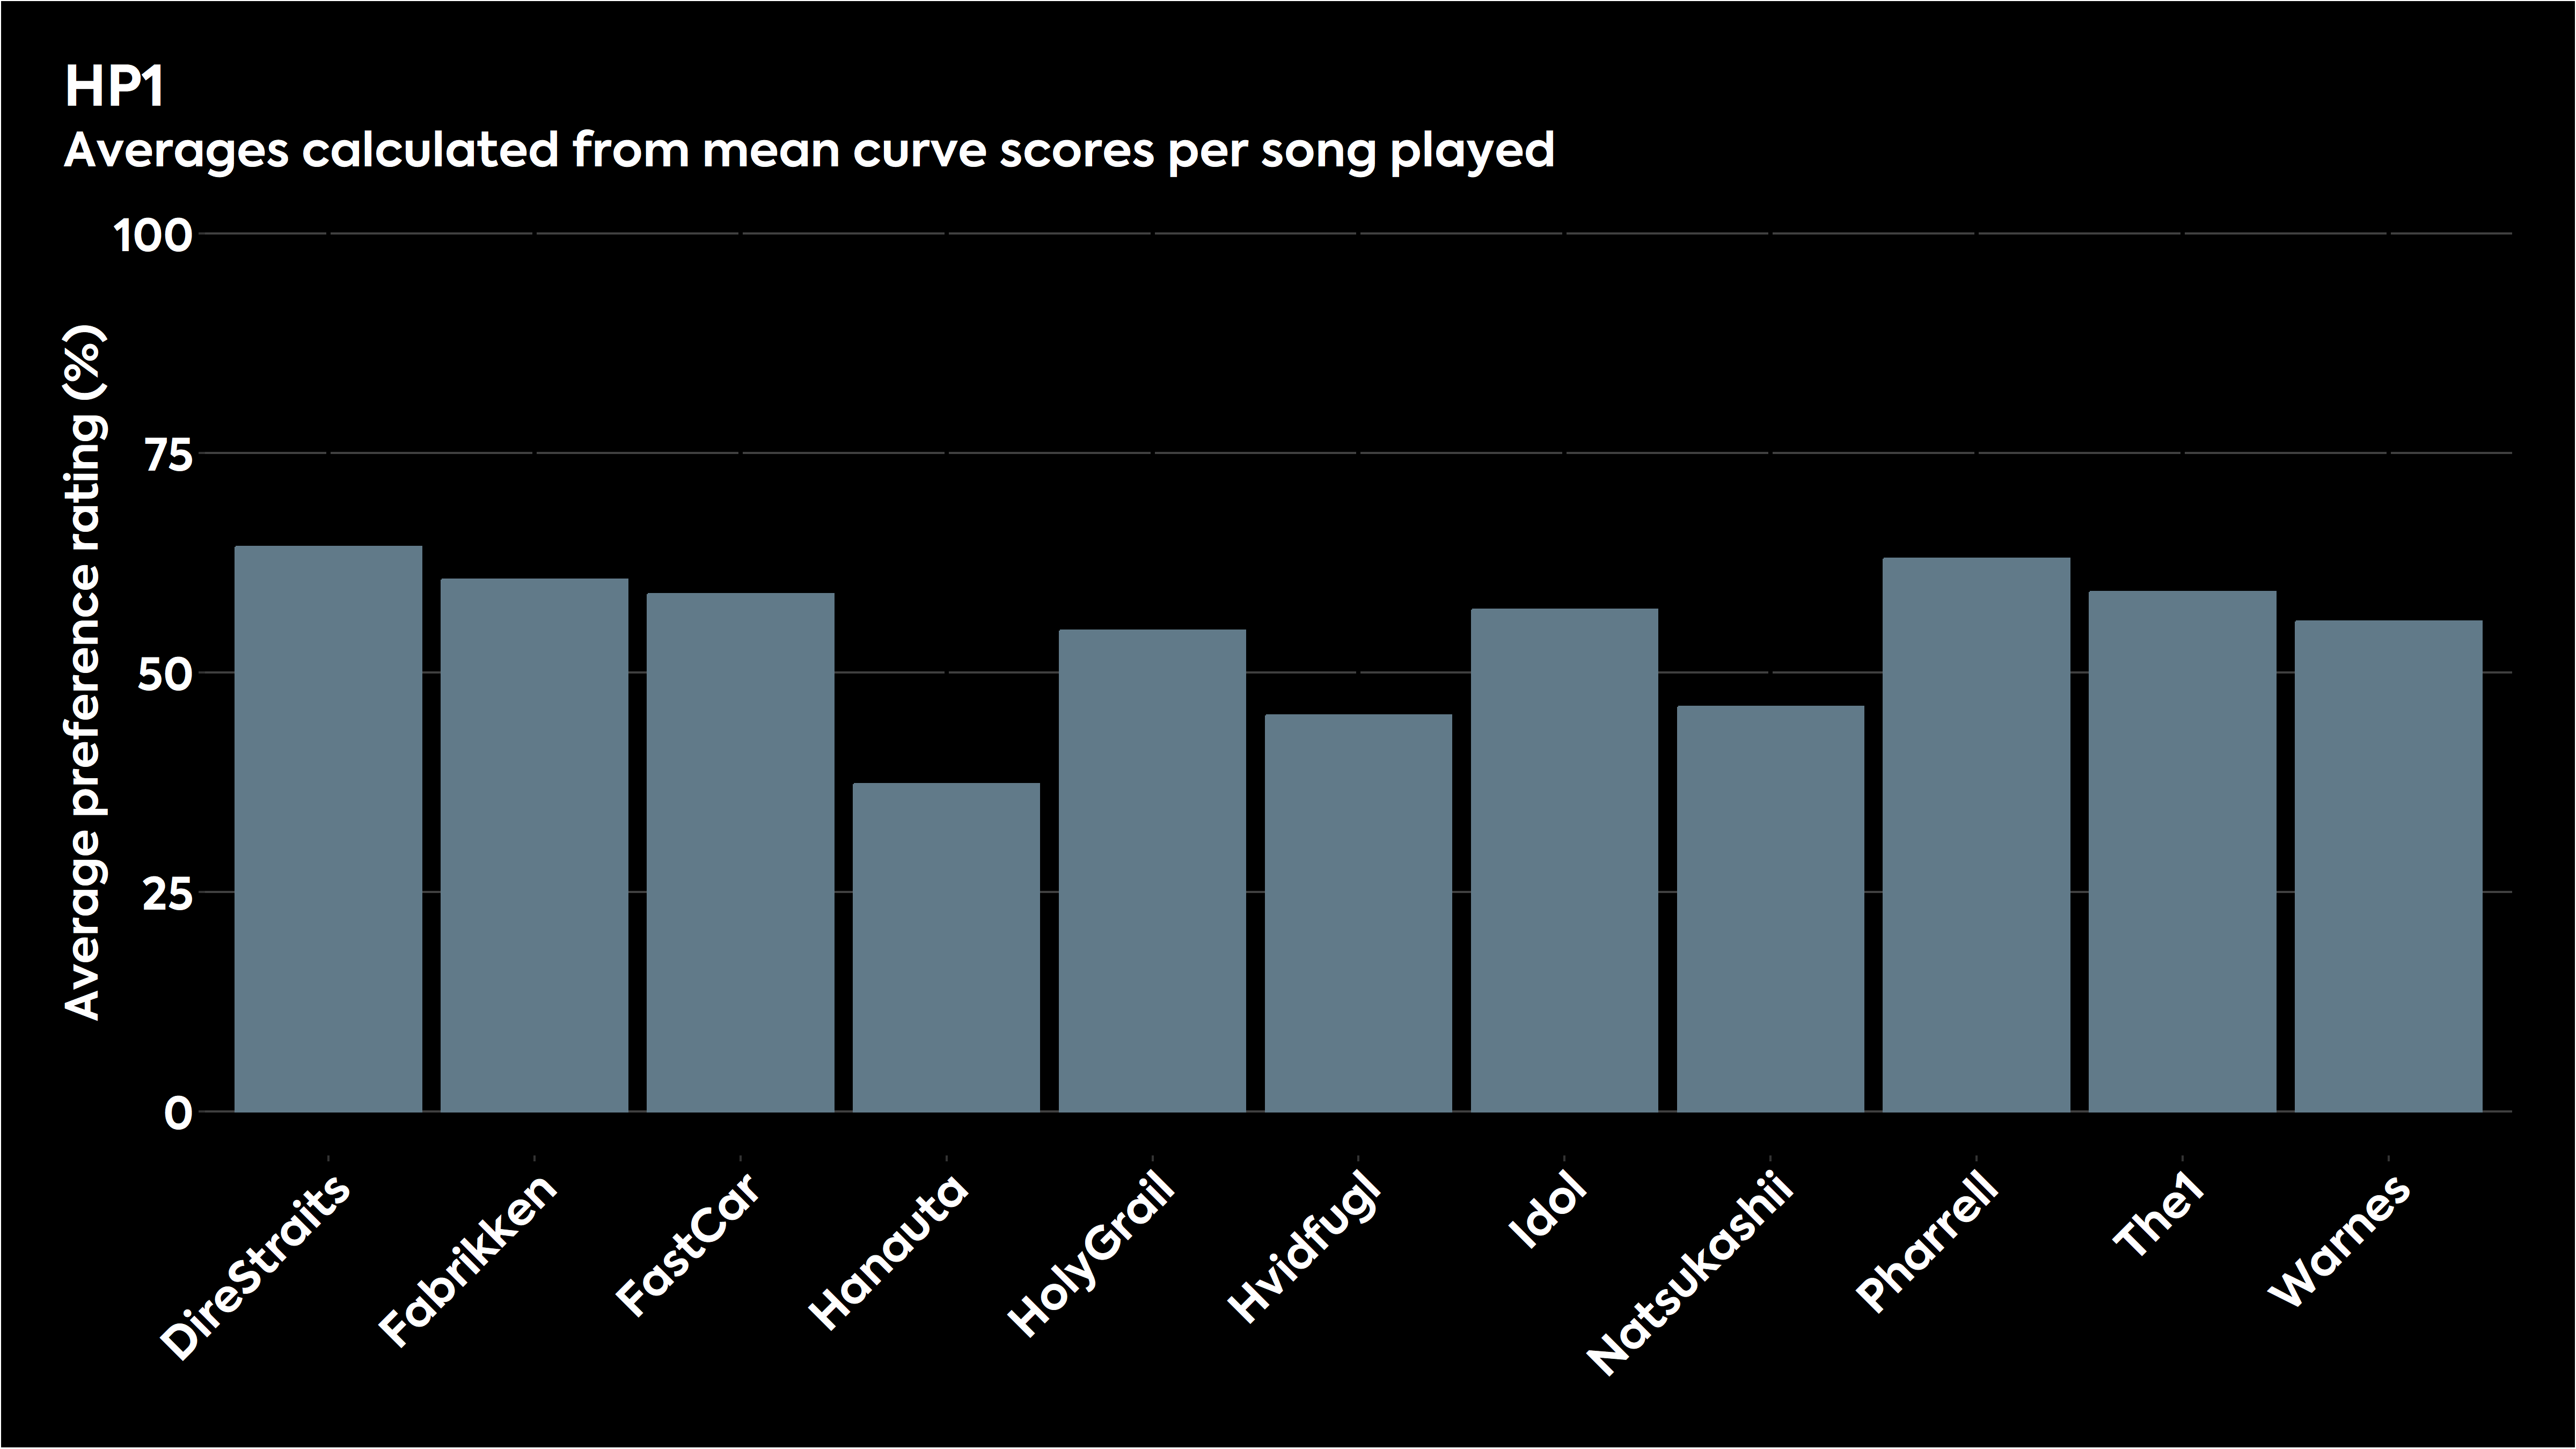
Bar chart showing how the various stimuli were judged for HP1 in listening tests.
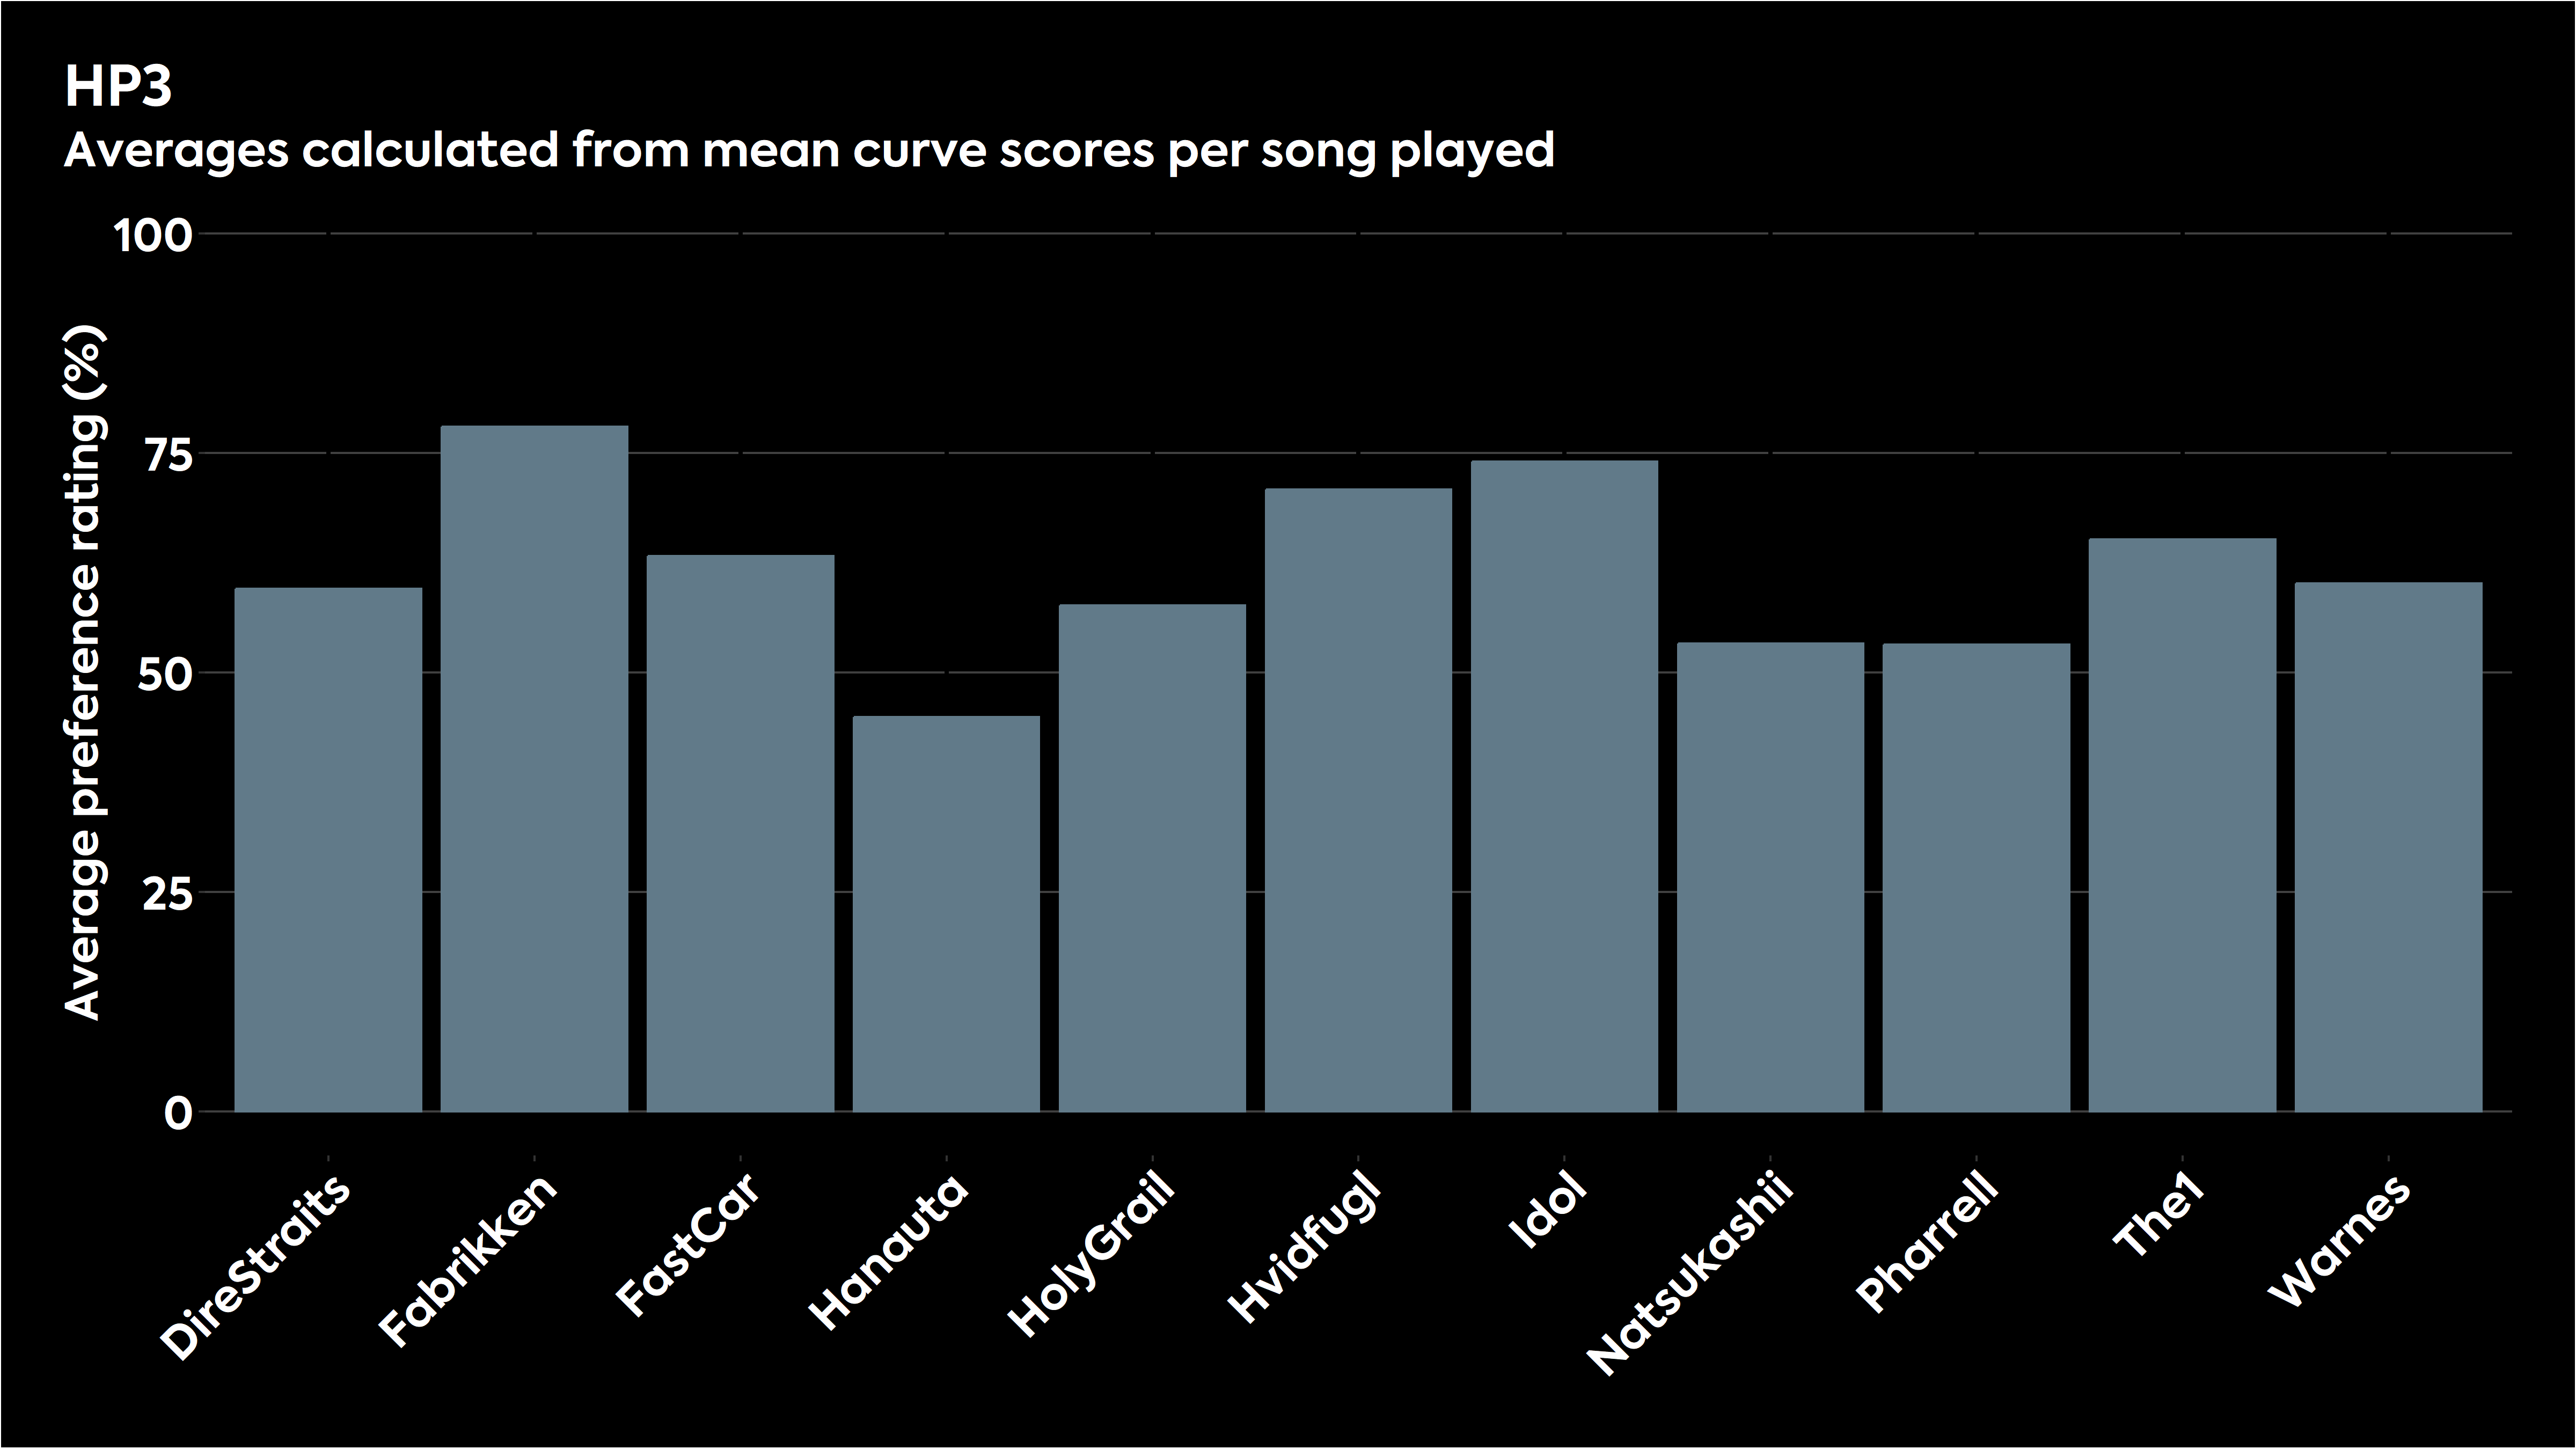
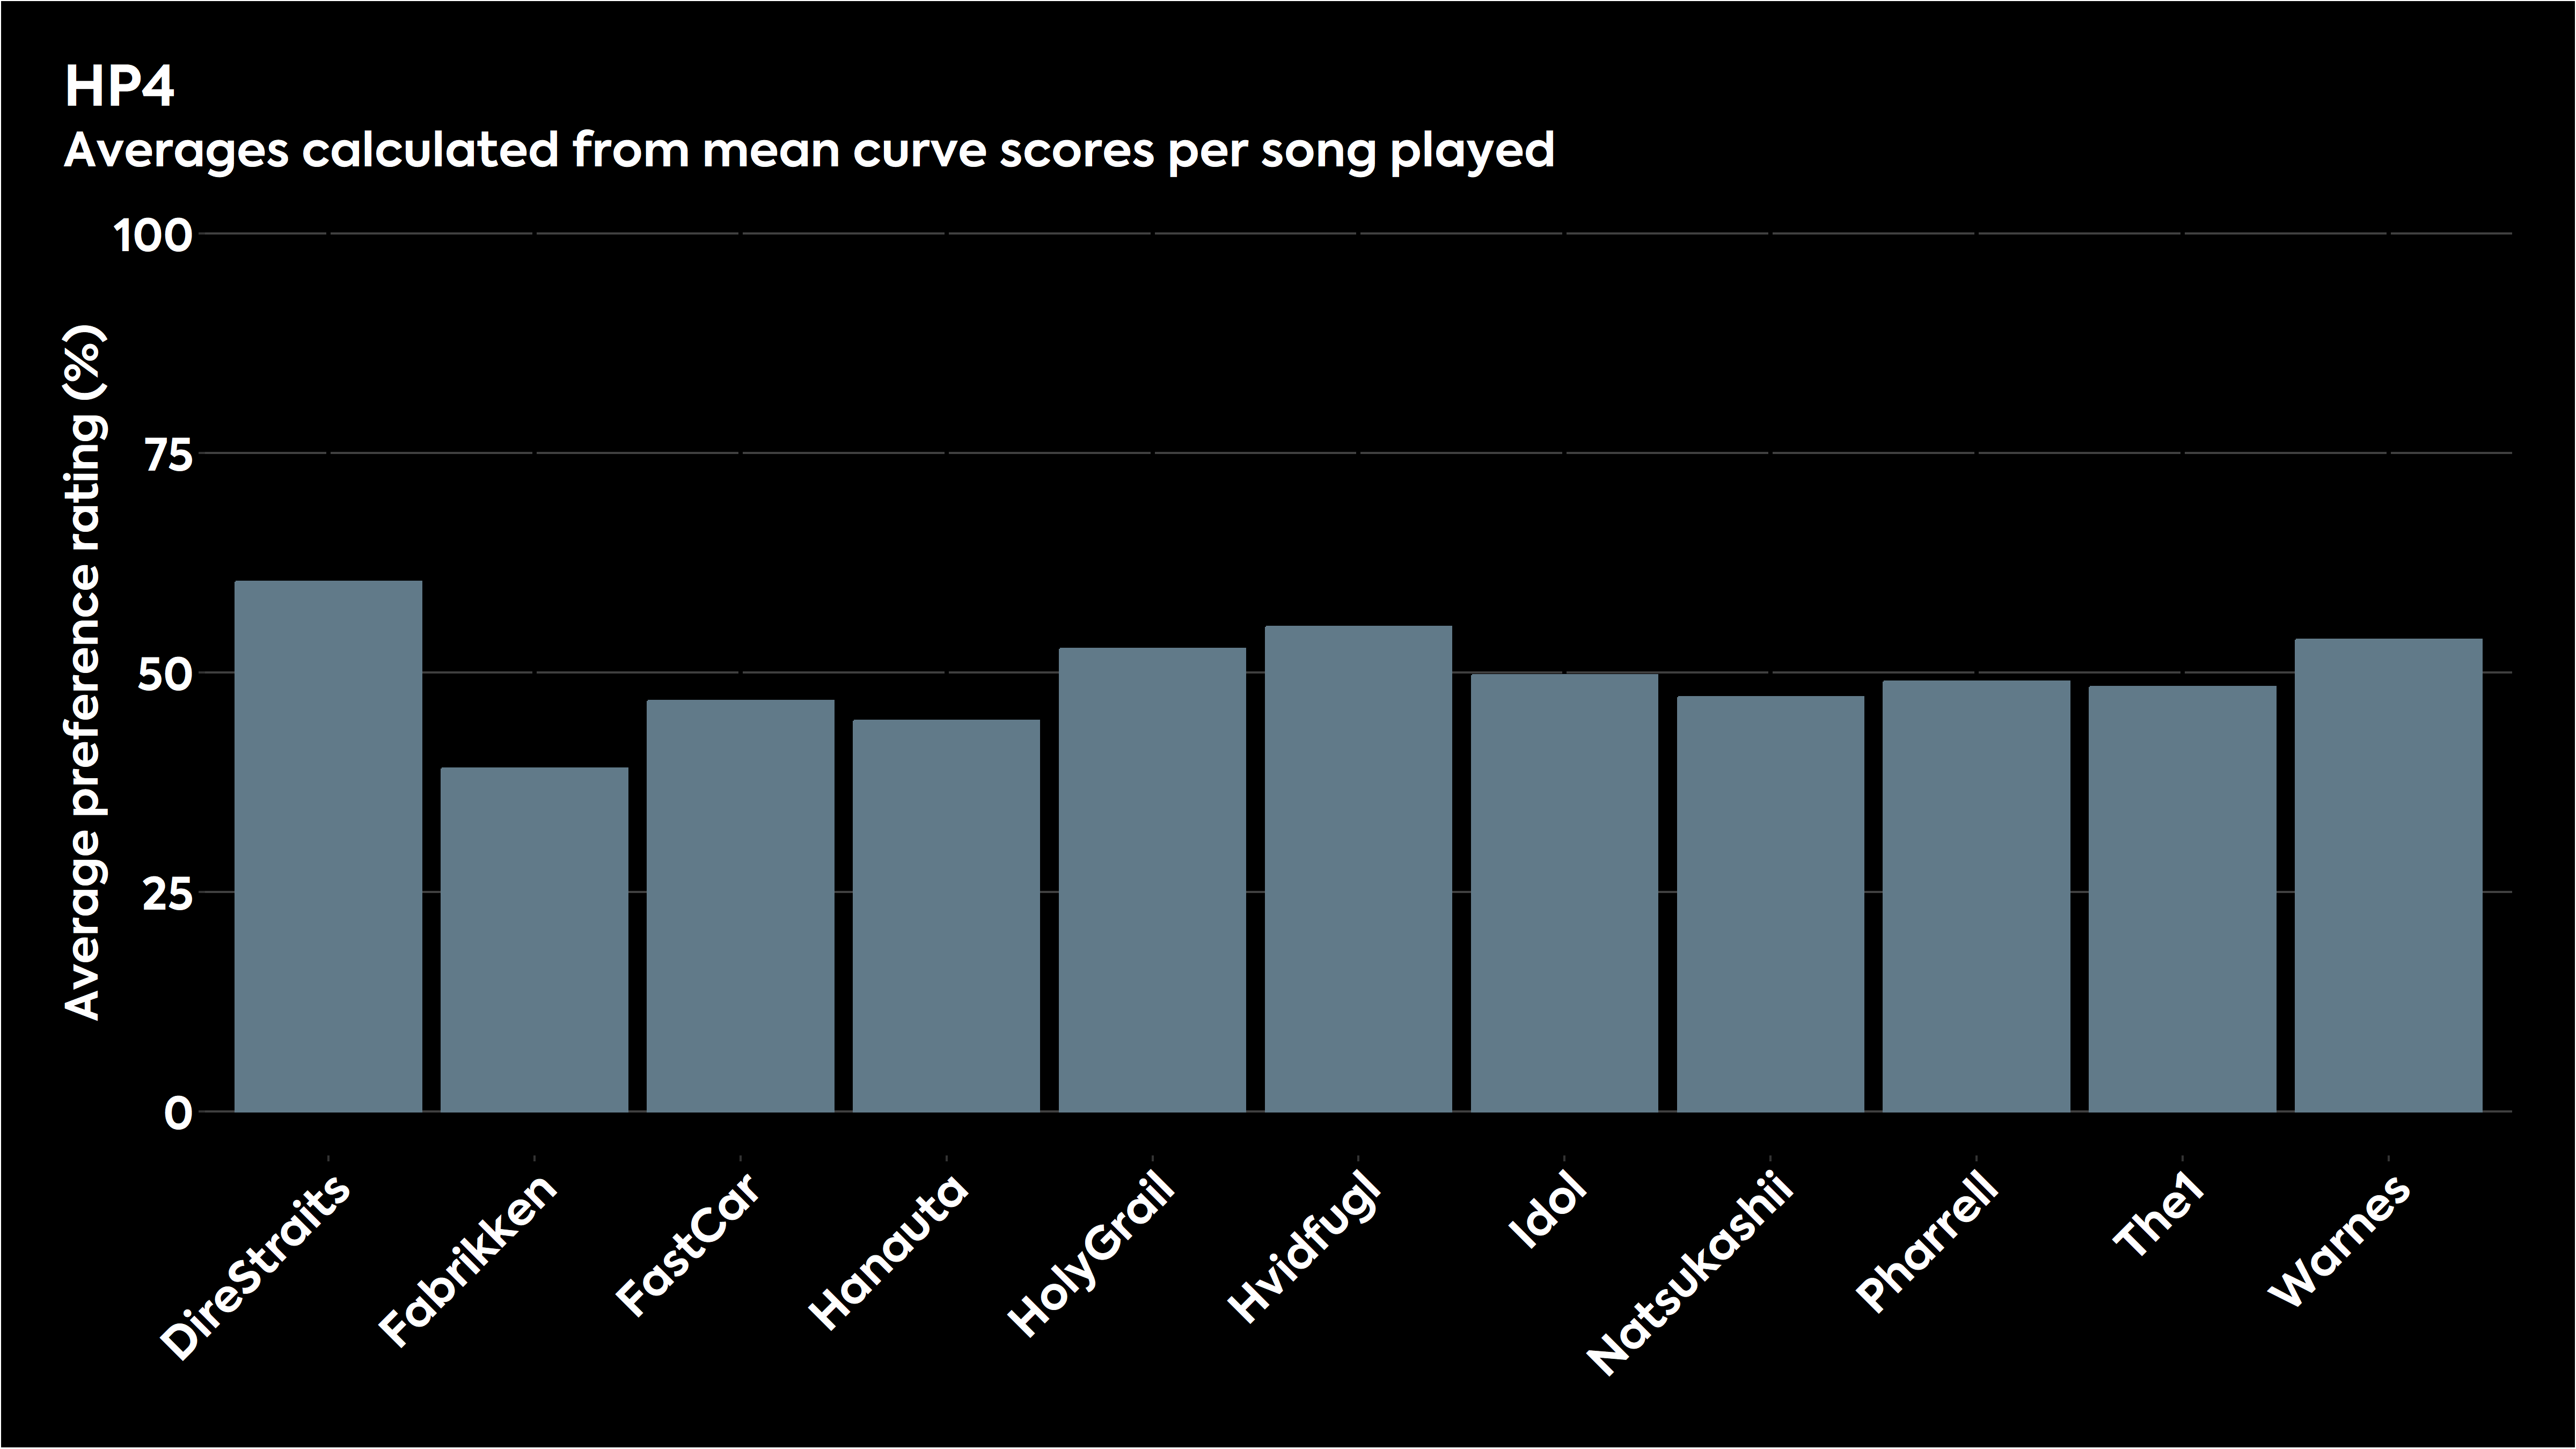
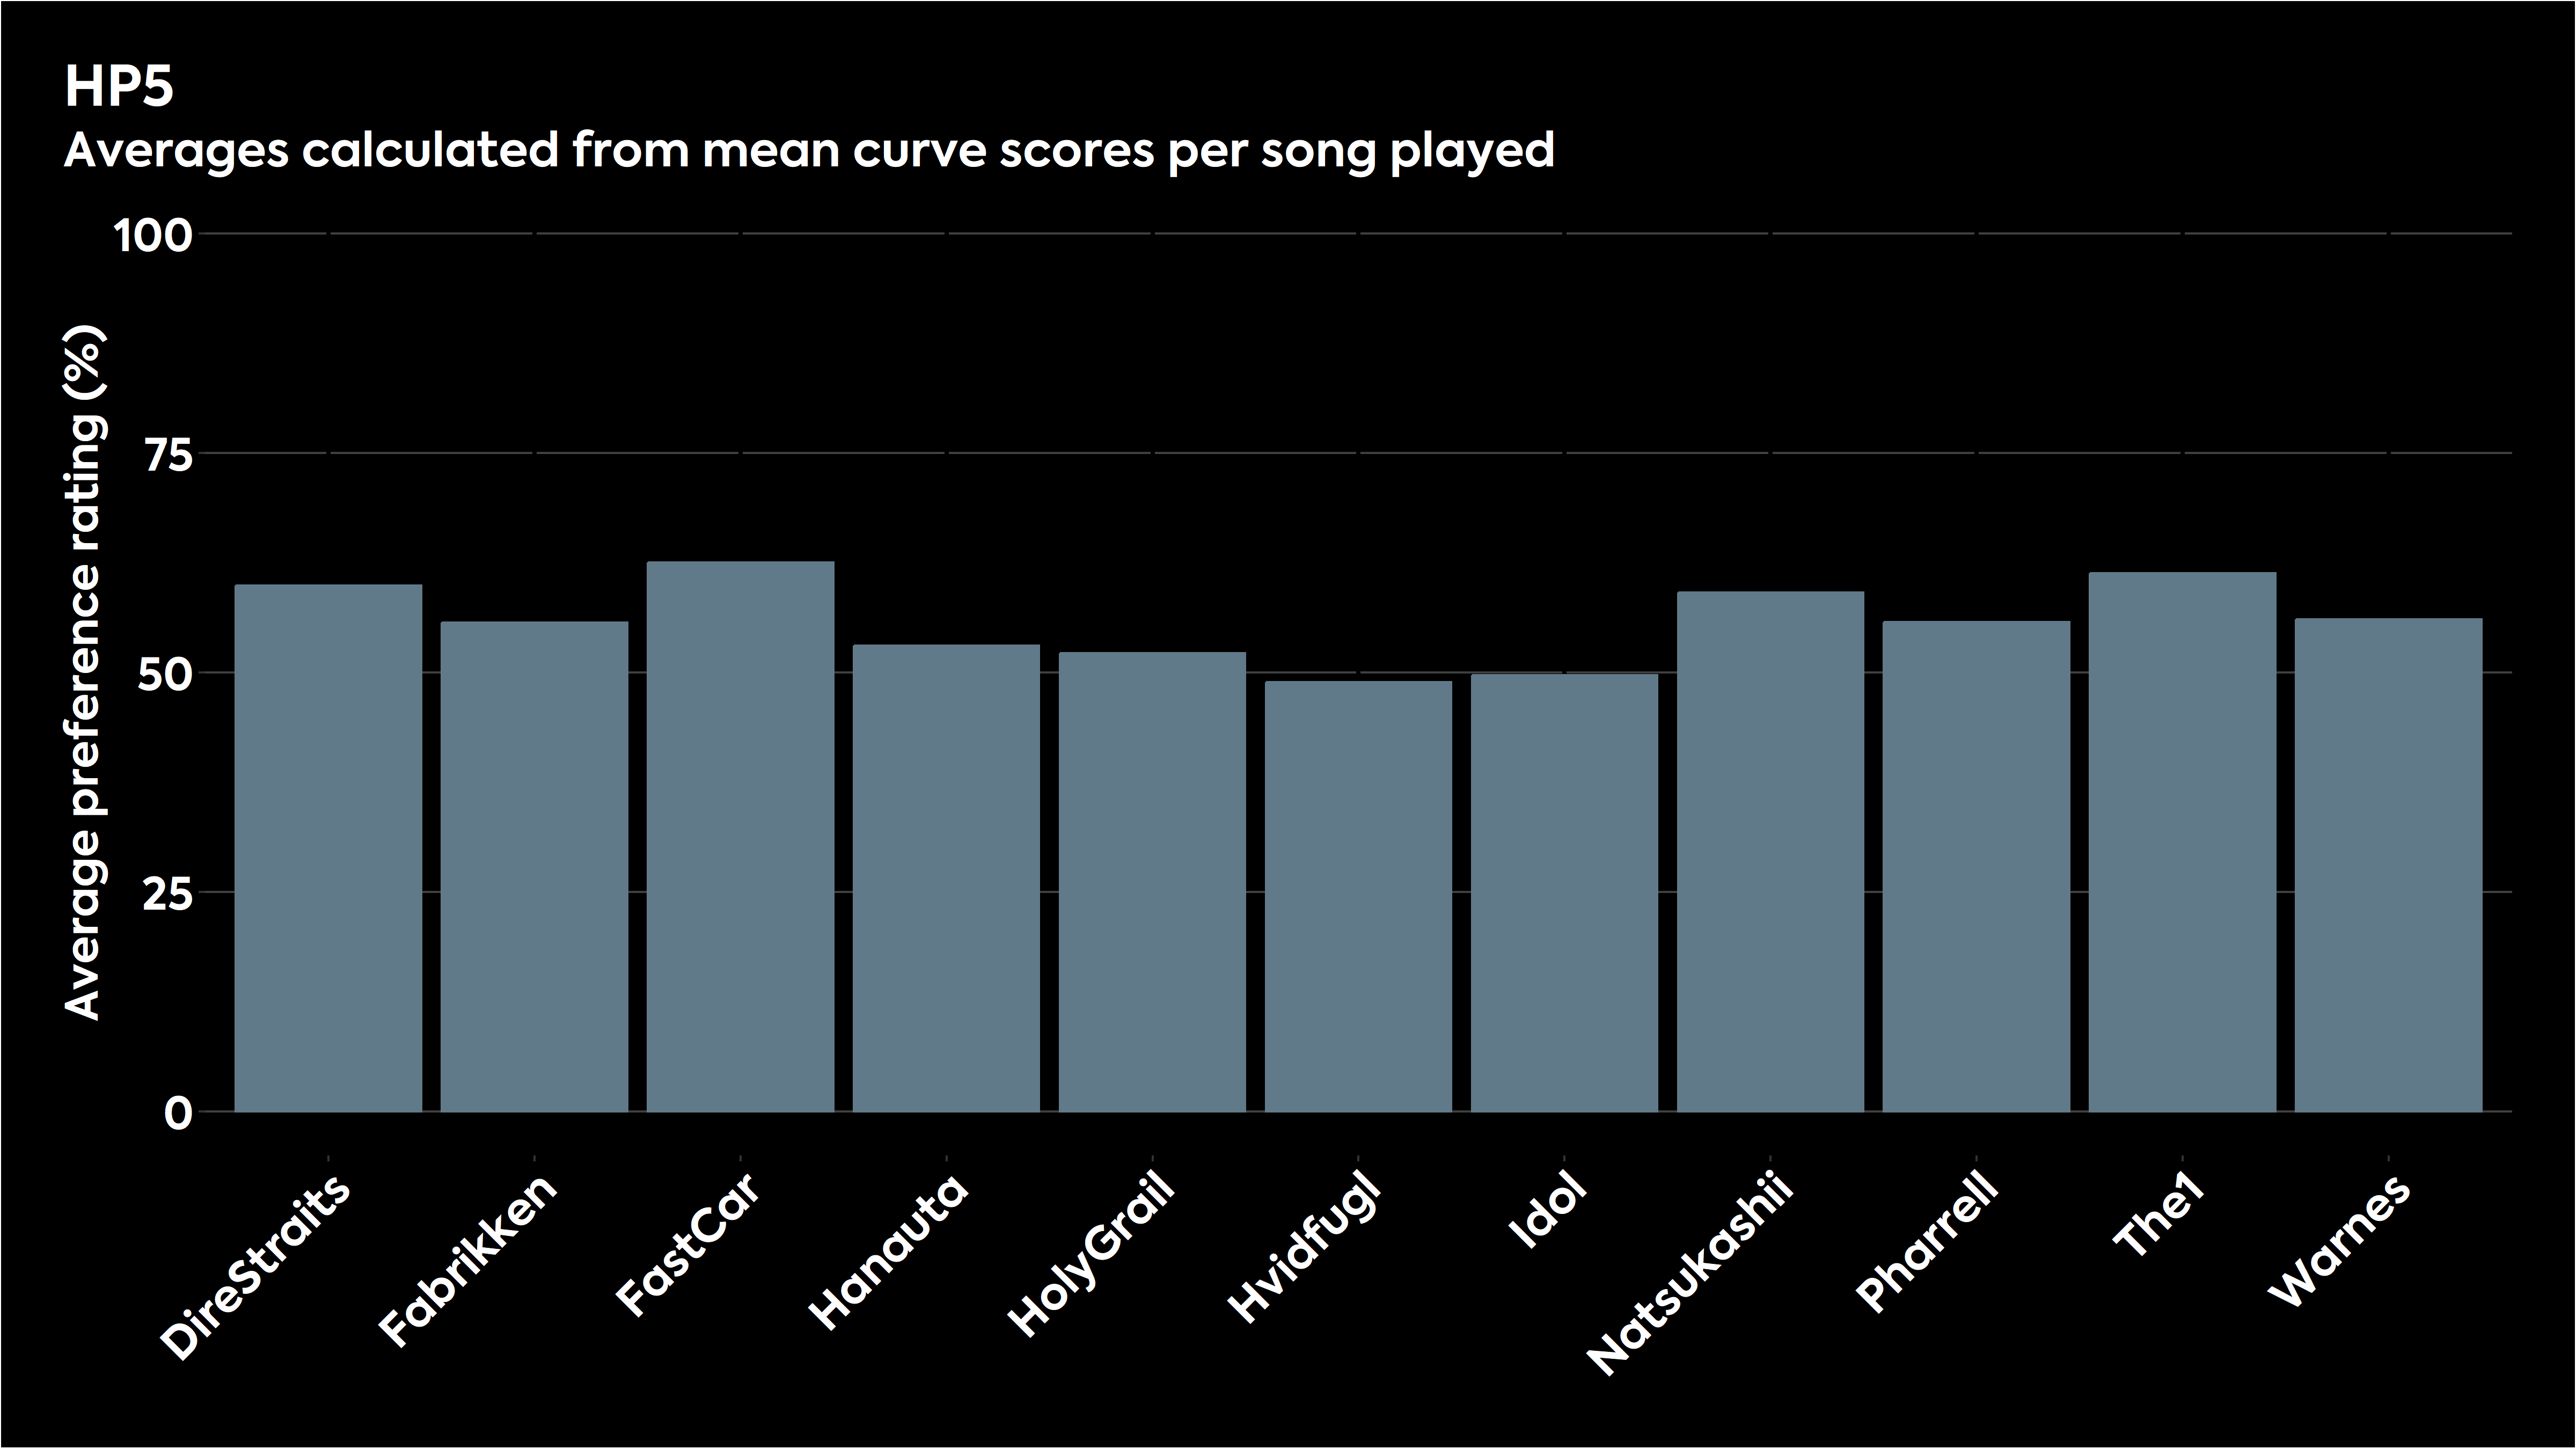
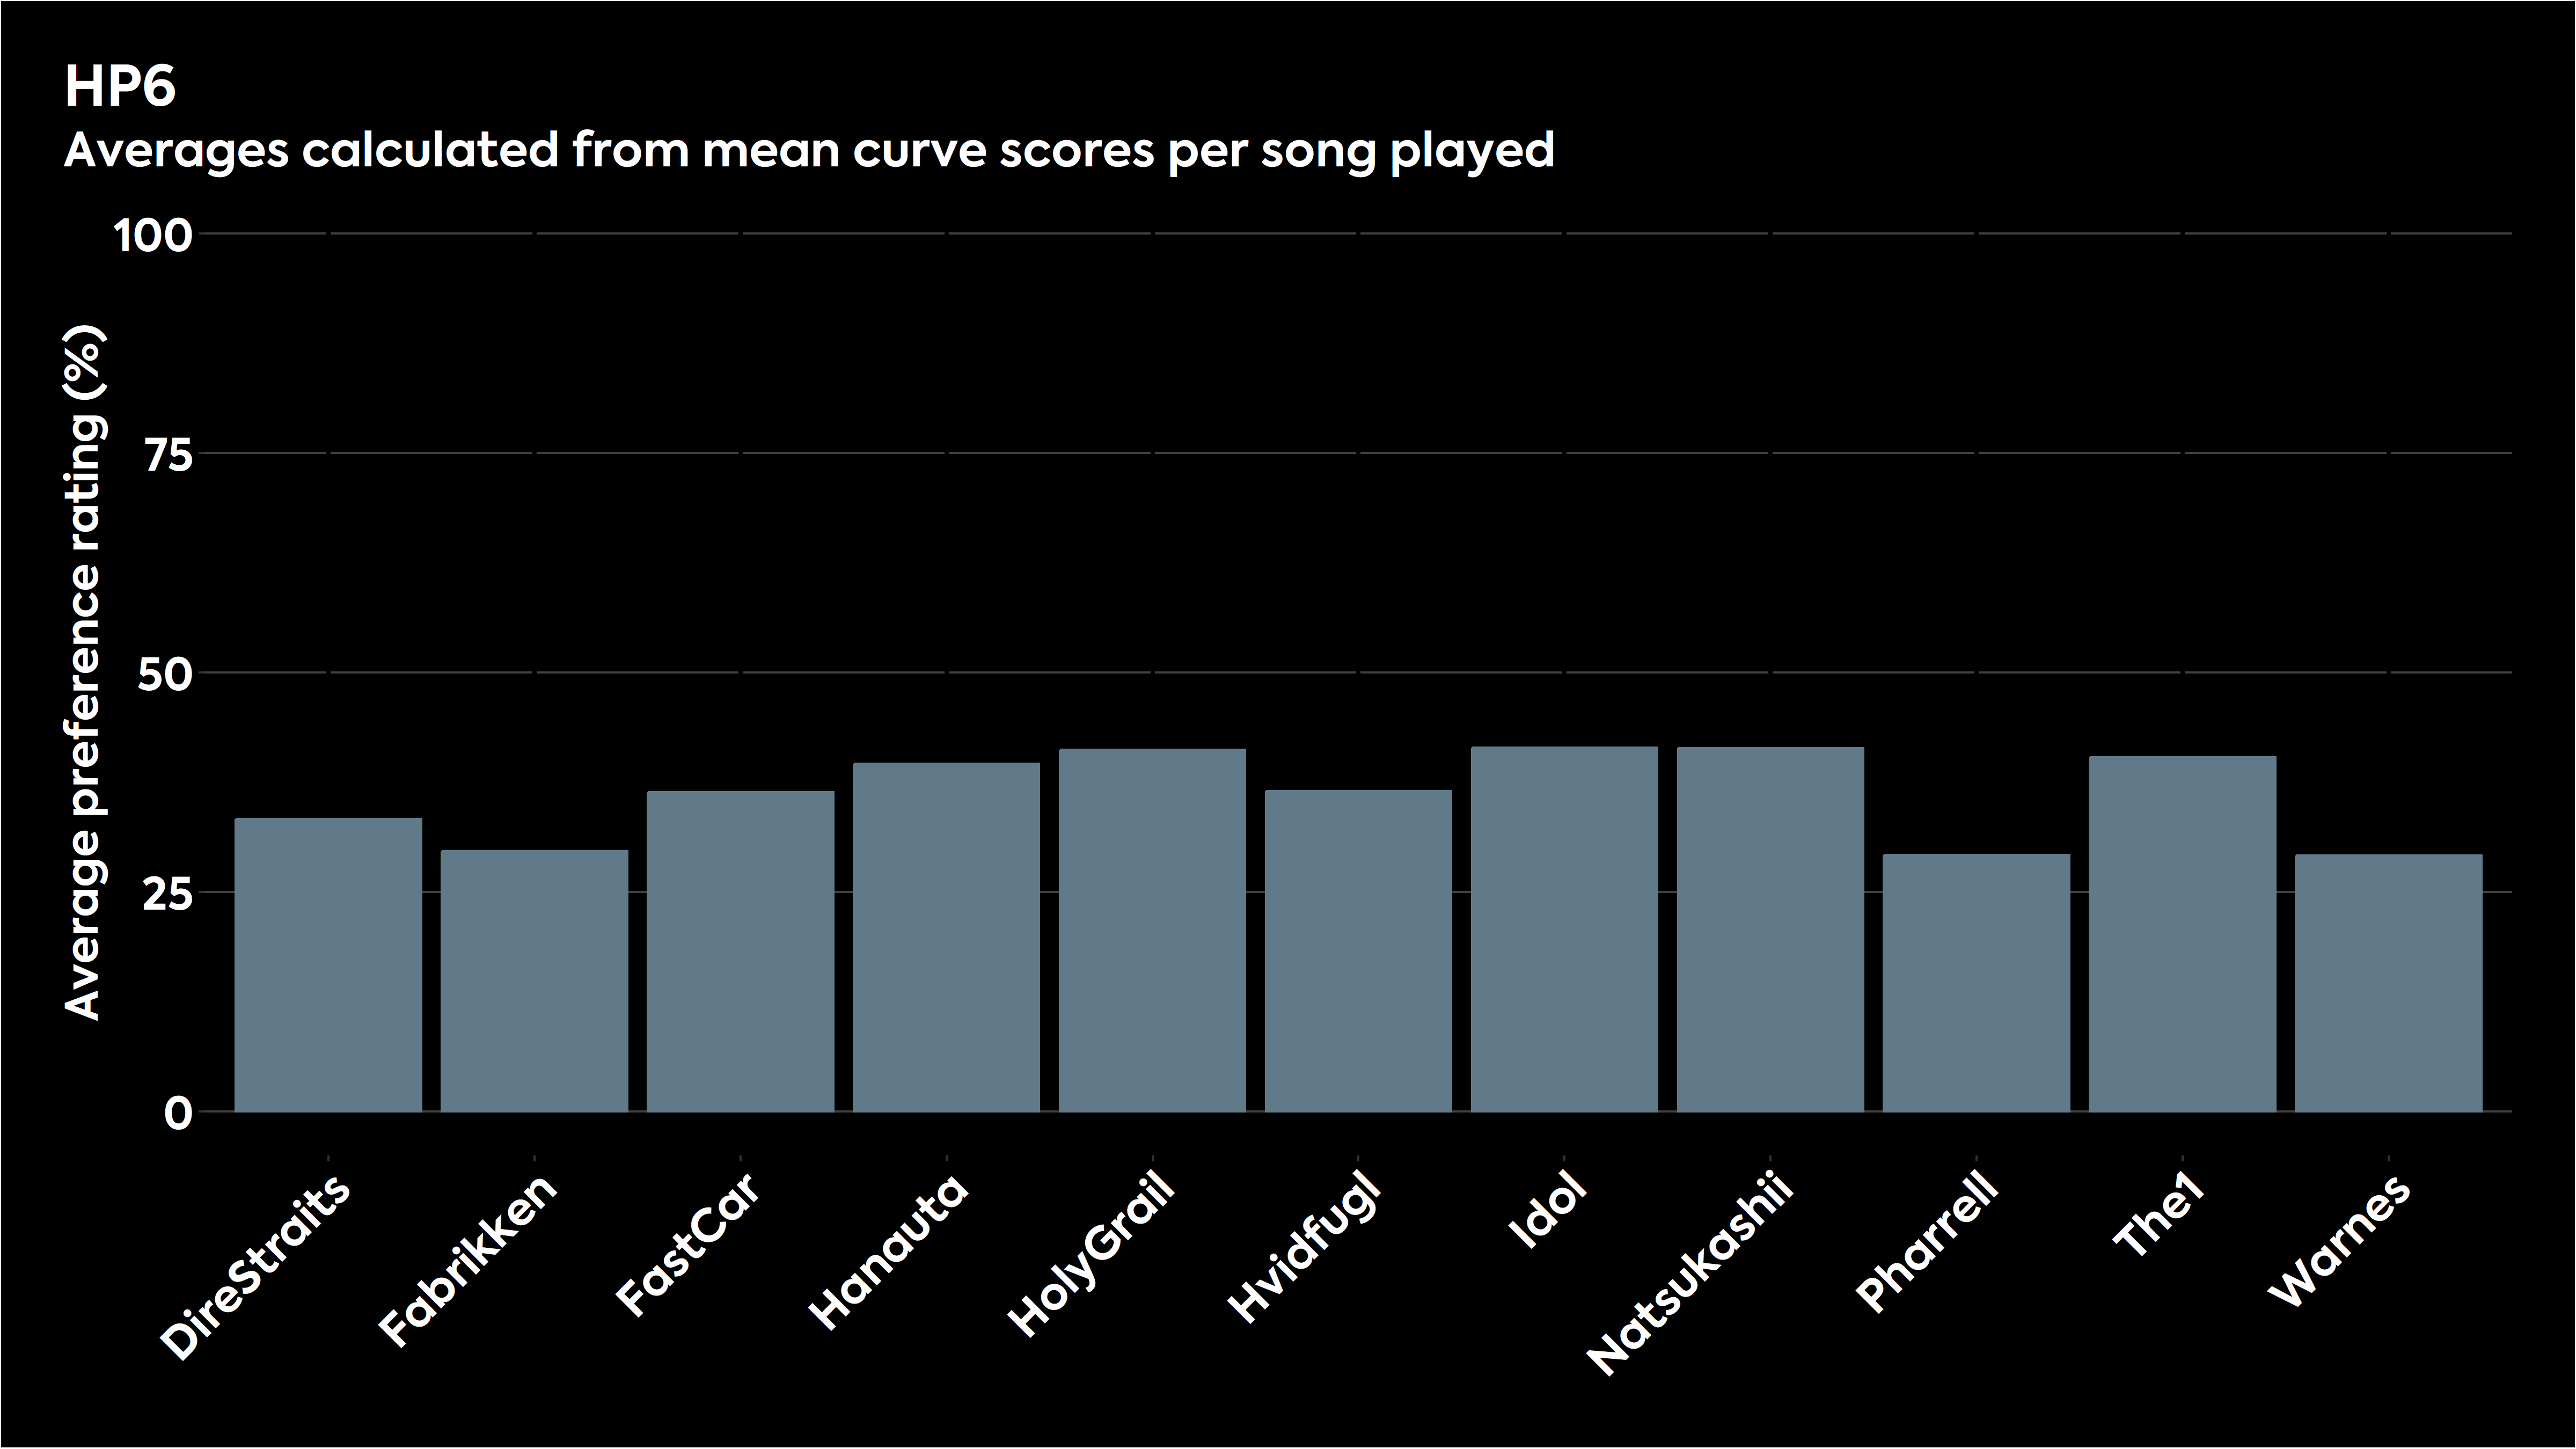
What can we learn from this AES paper?
One of the findings produced by the study is that there was no significant difference between the sound preferences of the two geographical groups that participated in the listening tests. This is welcome news, particularly for us as headphone reviewers, since we can have reasonable confidence that good sound is universal, at least as far as geographic demographics go.
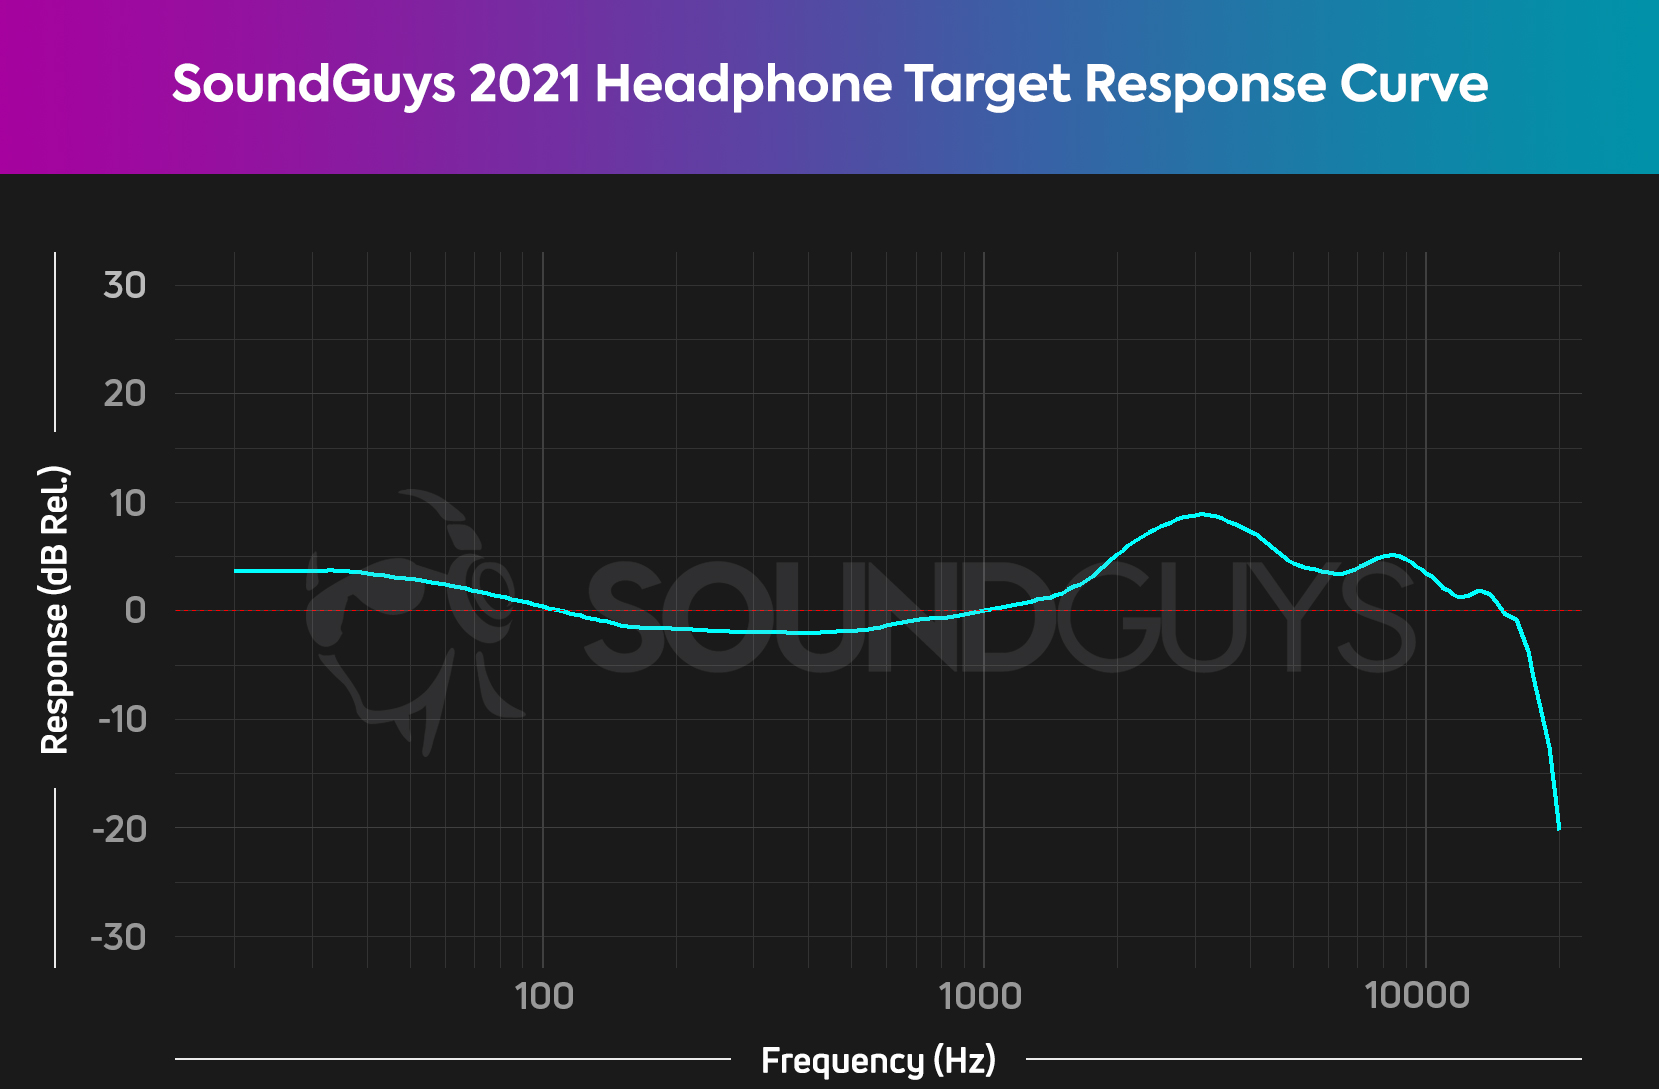
But more importantly, we now know that the headphone response preference curve we developed using a not-especially-scientifically-defensible approach back in 2021 isn’t too far off base. So, we can say that our proposed preference curve has been independently validated using controlled listening tests. In fact, in this listening test, our curve was preferred over the response curve presented by the Harman research in 2015.
The headphones selected for inclusion in these tests will likely draw some scrutiny, and identifying headphones HP1 through HP8 from the list of products testing isn’t a tall order since measurement data for those products is widely available (mainly from this site). But this is an excellent piece of work, and the inclusion of the curve we proposed in the experiment was unexpected and enlightening, so we’d like to thank the authors for that.
Despite providing us with some validation in our attempt, this paper has shown that there are headphone frequency responses that are more preferred by the listeners than our curve. Since this independent study was conducted using measurements on the same test platform we use, the B&K5128, it gives us some clues as to how we will be modifying our preference curve in its next iteration to be more representative of the listening preferences of the population at large.
Stay tuned for more on this coming soon!
What this AES paper doesn’t tell us
It’s curious is that our curve was included in this test, but other popular proposed targets were not. For example, no variations on the Diffuse-field correction (that was included) — such as adding a “downward tilt,” which many people online advocate for — were included. Four different versions of the Harman research curve were included, but the “extended high frequency” Harman curve variant proposed by Thomas Miller and Cristina Downey at Knowles (their “Preferred Listening Response“) was not included in the study, which is disappointing.
It’s important to recognize the general limitations of a “target curve” as it applies to a headphone’s frequency response. Just because a frequency response scores well in a listening test like this doesn’t mean it’ll be a perfect match for your preference, but it does increase the chances that you’ll like it. Any target curve, be it the Harman curve or the SoundGuys headphone preference curve, is more descriptive than prescriptive: headphones that sound good often have frequency responses that measure close to these curves.
“The Harman target is intended as a guideline and is not the last word on what makes a headphone sound good.” – Dr. Sean Olive.
The results from the test showed that there’s variability in preferences depending on the musical excerpt being judged. So it’s fair to say that there is song-to-song, variation, and no response curve is objectively better all the time. This could be an area for further study. There are also variables in listener groups including age, sex, and high-frequency hearing thresholds that were not examined in this study but have been considered elsewhere (the Knowles”Preferred Listening Response”).
It’s also worth noting that HP3’s frequency response is quite different from both the Harman 2018 and the SoundGuys response curves, but was ranked highly: sometimes departures from a standard aren’t necessarily “bad,” as evidenced by HP3 scoring so high.
