How we score
When you look at any review online, the first piece of information you’re introduced to is usually the reviewer’s score. But does that tell you anything? Well, it does if you’re on SoundGuys! We have a fairly unique way of approaching how we assess and quantify just how good or bad a product is.
Our philosophy
We want readers to be able to compare scores from product to product to product and be able to discern as much information as possible from them. What are they good at? What do they suck at? Is this battery better than that one? What if I’m looking at another product type?
While it’s tempting to score each product category by its own metrics, we opted to score every product with the same equations for the same scores. That way, no matter what you look at: you’ll always be able to tell which battery, sound quality, etc. is better by looking at the ratings. It may not be the first choice of everyone, but we want our scores to matter, and not be the result of one of our reviewers picking a number without any process behind it.

Because we need to quantify each scoring metric, we collect objective data from our products wherever possible. We strive to remove humans from the equation as much as possible where it’s appropriate so that there’s less possibility for error, and no room for biases. We also want to score based on the limits of human perception (or typical use) rather than what’s “best” at any given moment. Because of this, our scores are generally lower than most outlets’ assessments. We lay everything bare, and even the best products typically have their flaws. You deserve to know about them.
How we quantify battery life
Battery life is a strange thing to have to quantify, as what people call “good” varies from product to product. Because we don’t want to unfairly punish something for meeting most peoples’ needs—while also not unfairly rewarding something with a battery life that’s slightly better than others—we came up with an exponential equation to quantify our scores.
We first needed a little information to figure out what scores we should give to tested products. When we test, we measure and play back sound for our battery test at the same volume across all models to compare apples to apples. While our test level is fairly high for most people, it’ll give a lot of people the information they’re looking for.
We need to know how long most people listen to their headphones daily. We posted a poll to Twitter to gather results, and 5,120 people responded:
Okay, so around 75% of respondents listen to music for three hours or less every day. Because we want to grab more people without setting an unrealistic goal, we set our midpoint for scoring at 4 hours. That means, if something lasts 4 hours in our battery test: we give it a score of 5/10.
We already knew most people sleep at night (and can therefore charge their headphones while they sleep) so if a product exceeds 20 hours, its increase in score starts to exponentially diminish as it approaches the maximum possible score. The difference between a battery life of 24 hours and 23 hours isn’t as big as the difference between a battery life of 2 and 3 hours, for example. Any products that can last over 20 hours will score in between 9/10 and 10/10.

Obviously, some product categories will score better or worse here, and we’re fine with that. By keeping all of our battery scores on the same metric, you can directly compare the scores across any product category.
How we quantify sound quality
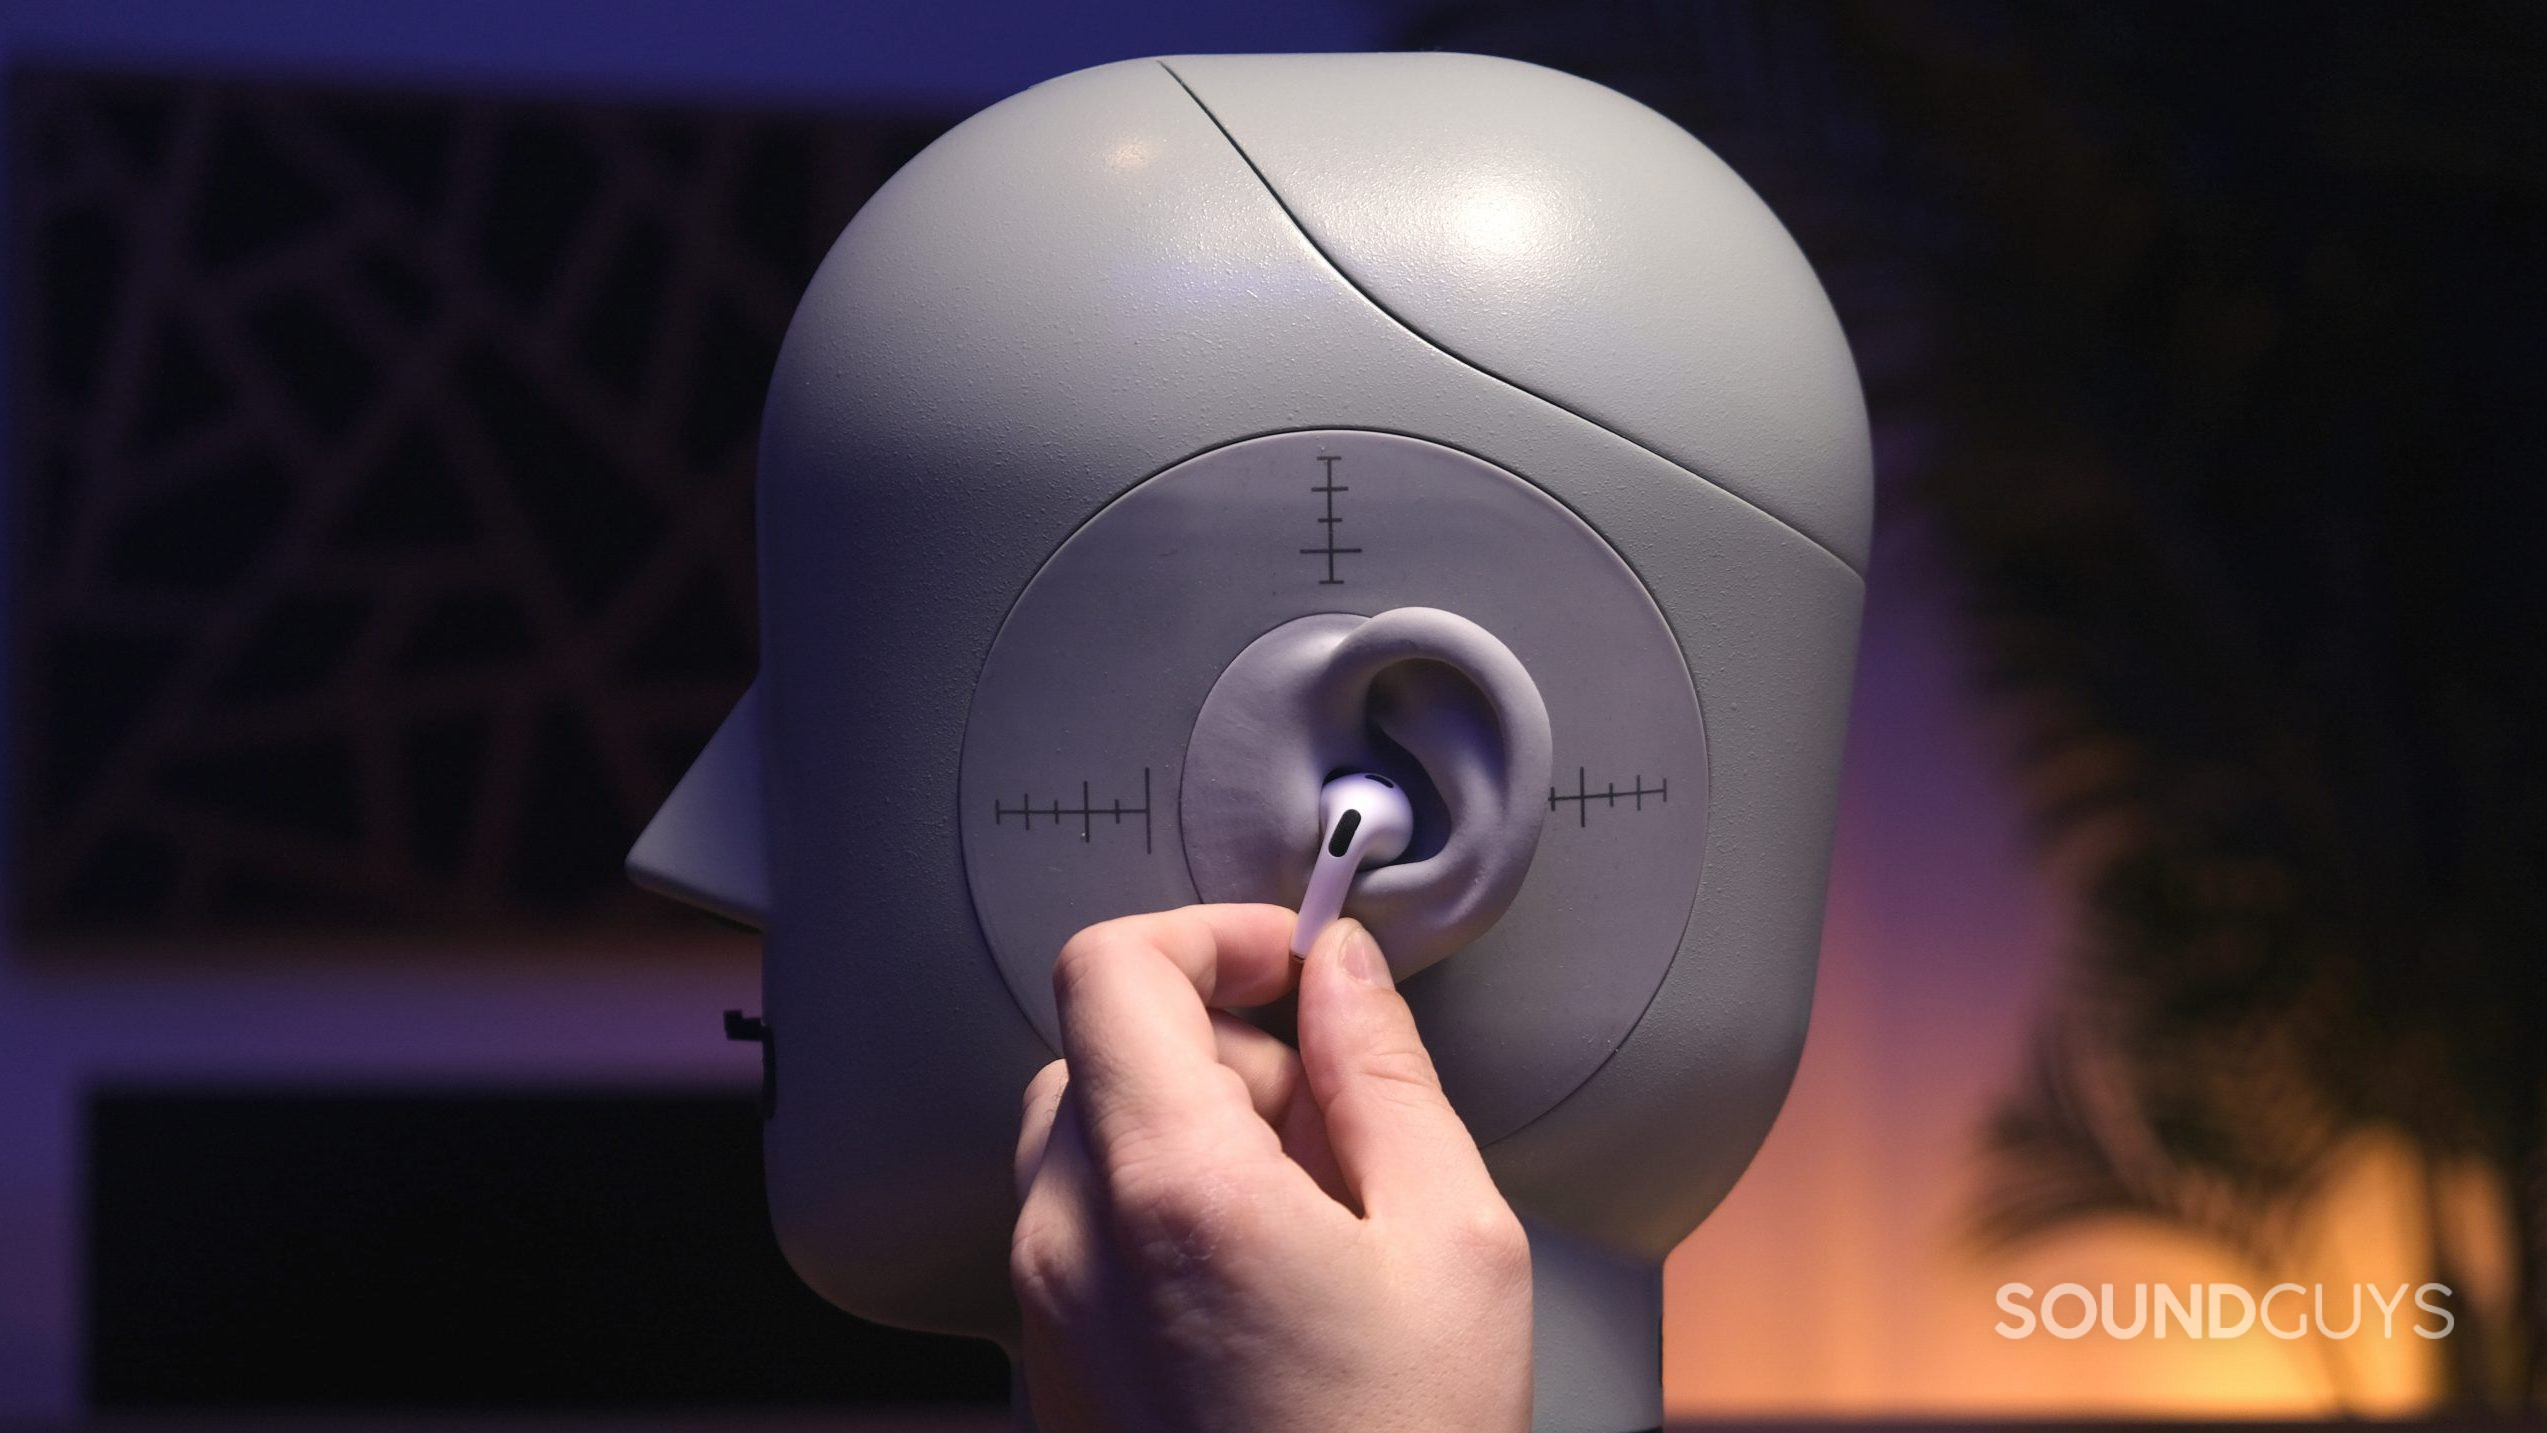
Like other audio sites, SoundGuys owns and operates its own test setup, including equipment from industry-leading companies. Unlike other audio sites, we’ve taken a gamble and grabbed a measurement apparatus that goes to greater lengths in approximating the human anatomy of the ear.
By testing several metrics (some that we don’t post in reviews unless there’s something really wrong), we can contextualize audio quality—even if we can’t completely pinpoint how a product will sound to your ears. We currently measure frequency response, distortion, left-right tracking, inter-channel crosstalk, and isolation/noise attenuation. By measuring these things, we get a dataset that we can then use to compare all the products in our database. There is no one “ideal” response, so we try to give each product the best shot possible at being evaluated against their intended use—however we have derived our own independently-verified house curves for this purpose. But this only covers the context for the reviews, not the actual scores themselves.

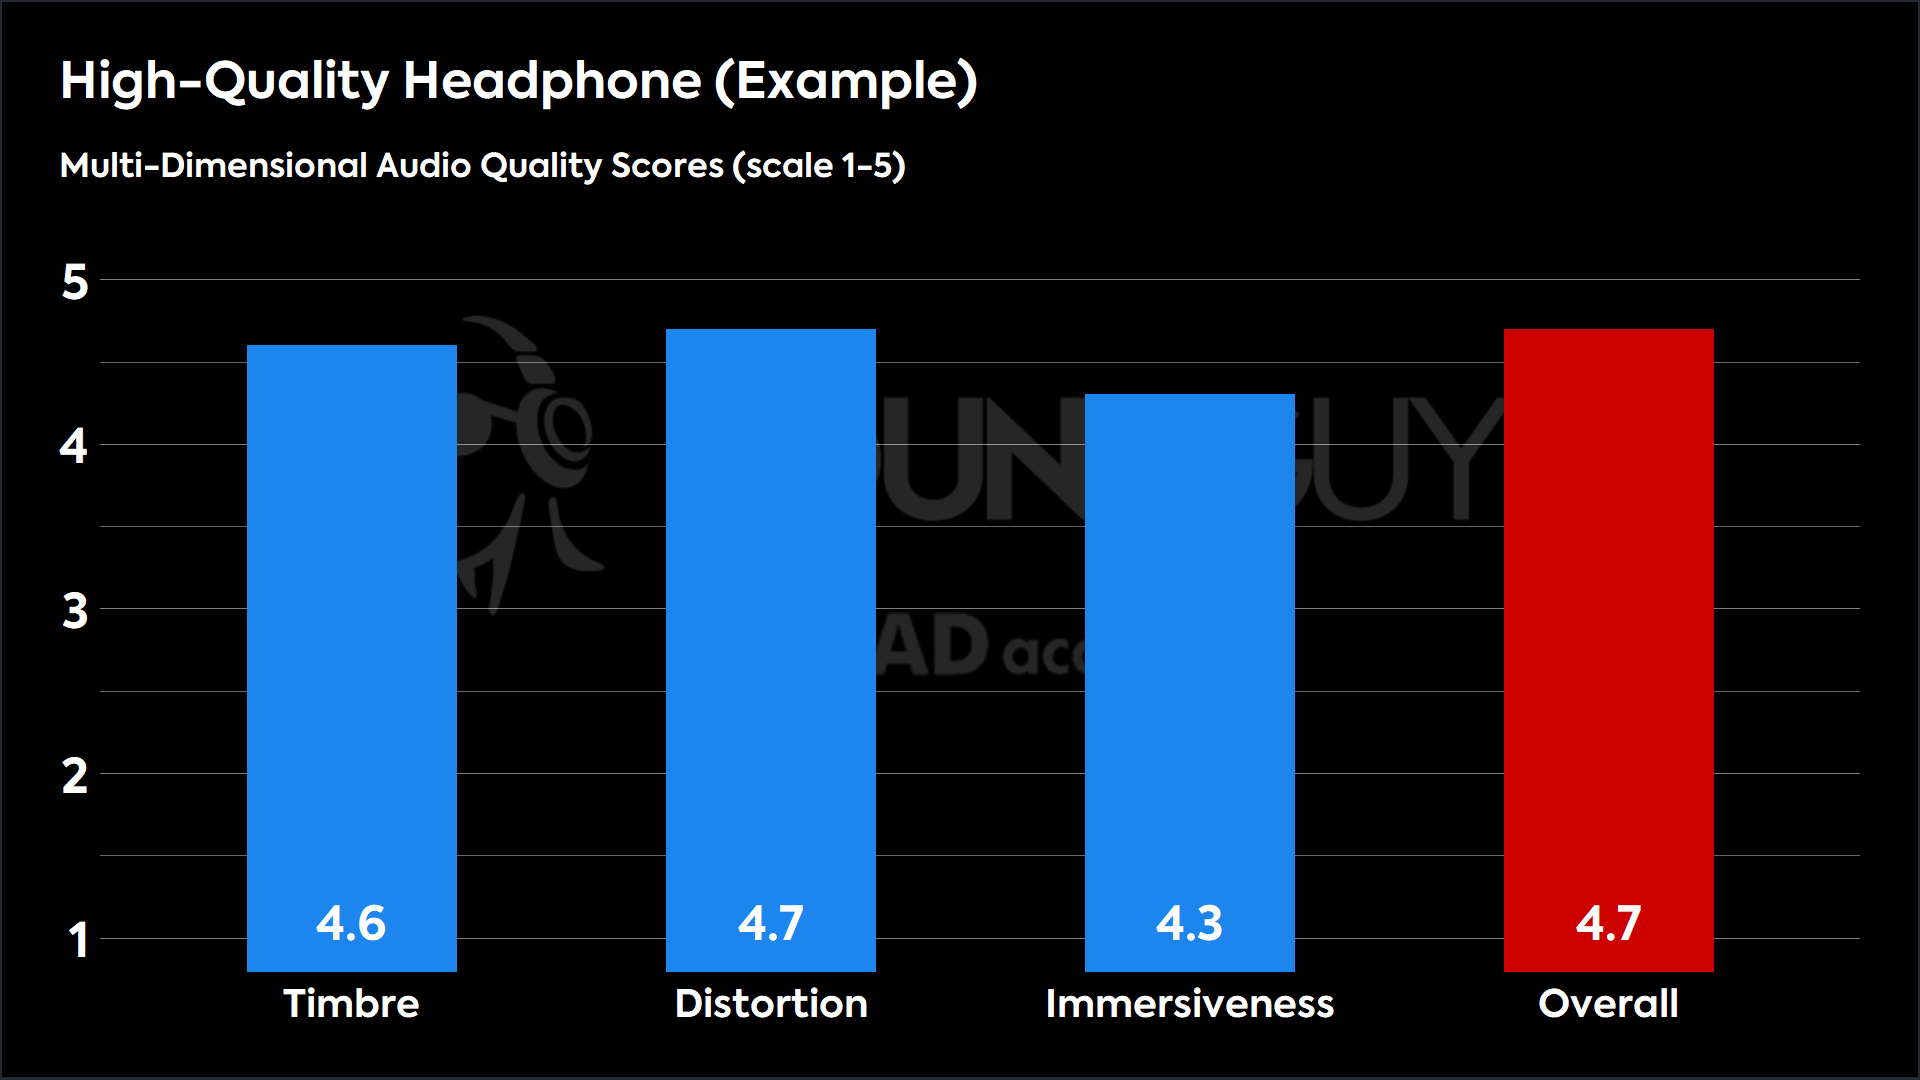
For that purpose, we’ve partnered with HEAD Acoustics, a sound measurement company, to derive scoring for the sound quality of headphones and other products. By using their Multi-Dimensional Audio Quality Scores, we can better quantify how well hundreds of virtual listeners would rate the sound quality of any device we test. Each of these numbers represents what’s called a “Mean Opinion Score” (MOS), which represents the average score from 1 to 5 that our virtual panelists would rate the device we tested. These scores are collected for three subscores: Timbre, Distortion, and Immersiveness. These three ratings are then used to calculate an overall score.
Timbre (MOS-T) represents the playback system’s spectral properties and temporal resolution. The timbre analysis considers the following:
1. The frequency response of the DUT is compared to a target frequency response derived from the listening tests. The metric calculates a quality value from the comparison.
2. Spectral flux, described as the DUT’s reproduction of the signal‘s temporal structure.
3. Comparison between source signals and recorded signals of essential frequency bands for the listener to evaluate the audio quality of the DUT, specifically bass (50 Hz – 250 Hz) and upper midrange (2 kHz – 4 kHz).
4. HEAD acoustics’ hearing model is used for many attributes of the human hearing system.
Distortion (MOS-D) represents non-linearities and added noise. The distortion analysis considers the following:
1. Delta in frequency response: The frequency response of the DUT is compared to a target frequency response derived from the auditory assessment.
2. Harmonic distortion.
3. Analysis of the spectrogram of the sweep signals (looks for non-linearities).
4. Modulation spectra.
Immersiveness (MOS-I) represents perceived source width and virtual source position. The immersiveness analysis considers the following:
1. Delta in frequency response: The frequency response of the DUT is compared to a target frequency response derived from the auditory assessment. A quality value is calculated from the comparison.
2. Spectral flux indicates the reproduction of the signal‘s temporal structure. This is important for spatial perception of the audio signal.
3. Comparison of spectral content in the upper mid-range frequency band is most significant.
4. Binaural hearing model: Two variants of differences between correlograms. The model quantifies the spatial perception of a human listener.
How we quantify mic quality
Much like we do with playback quality, we capture the performance of the microphones in each product. Using those recordings, we can outsource this duty to you, the reader. In order to demonstrate what each microphone sounds like, include short clips of us talking as captured by the product. Underneath our microphone samples, we have a poll that’s extremely-loosely based around the philosophy behind the ITU-R BS.1116-3 perception test. We feel that a large network of people using different playback systems are a great source of opinions on microphone quality; especially when that’s what the people you talk to are going to be using, too.
How we score isolation and noise canceling
Much like we score the sound of the products we review, we also score how well they destroy (or simply block out) outside noise. We contend this is one of the most important metrics for all people, so it’s a little more important that this metric is easy to understand.

In order to provide a general guidepost for most people, we rate both isolation and ANC on the same scale. We take the mean level of outside noise reduced, translate that into how much noise is attenuated perceptually in percent, and then take that number and fit it to our scale. For example, the only way to get a 10/10 is to block out 100% of outside noise. A set of headphones that canceled 68% of outside noise would score 6.8, and so on.
Because we don’t alter scores based on product category, sometimes standout products won’t score that high in metrics like isolation, even if they’re the king of their tiny mountain. This is intentional. We want our scores to be able to be used in comparing across product categories so there are no illusions about the tradeoffs some designs make.
The unquantifiable
Of course, not all scores can be objectively reduced to simple numbers and equations. Things like design features, remote utility, and the like are getting more complicated by the day—so we have staff rate these metrics. It’s really no more complicated than that. While we keep this type of score to an absolute minimum, it’s unwise to let it go unaddressed. However, as we’re trying to make sure that we’re providing meaningful comparisons across categories, they must be applied in the same way for every product type—meaning some product types necessarily score more poorly in some areas than others.
Build quality
Not all headphones are made to last, and it’s usually quite apparent from the materials they’re made of. We try to list as much as we can about the construction of the cans, whether they have removable cables, and other concerns about durability.
- Godawful
- Will fail, but not actively cause harm
- The Dunk’s of products—not good, but works
- Worse than average, fragile
- Perfectly average build, some major faults
- Better than average, but still not where it needs to be
- Good, with a few caveats (IPX3)
- Good with no caveats (IPX4)
- Great with no caveats (IPX7)
- Perfect, near-indestructible force that would shatter diamonds when smashed against them
Portability
Like it or not, some headphones are more portable than others. Though different form factors are more suited to your tastes, earphones will almost always be more portable than huge audiophile headphones with a cable, for example.
- Hard-wired, can’t fit into most overhead storage compartments
- Can’t be worn outside without ridicule AND risk (open back with no membrane)
- Can’t be worn outside without risk of damage
- Can’t be worn outside without looking a bit out of place
- Can be worn outside, but is a pain to do so
- Can be worn outside somewhat inconveniently
- Can be worn without bother, can’t fit into pants pockets
- Can be worn without bother, can fit into pants pockets
- Can be worn without bother, can fit into pants pockets, water-resistant/proof earbuds or case
- Full case can merge with your skin
Comfort

Obviously, no two heads are identical, but we can figure out when headphones aren’t going to be right for you by actually trying them out. We check for heat buildup, how much force is put on your head, and many other considerations. We never review a set of headphones without using them for hours on end.
- Will cause irreparable damage to you
- Bad fit, bad seal, pain
- Okay fit, acceptable seal, discomfort
- Okay fit, decent seal, some discomfort
- Standard fit, not much to complain—or gush—about
- Good fit, decent seal, no discomfort
- Good fit, good seal, can listen more than 1h without discomfort
- Good fit, good seal, can listen more than 2h without discomfort
- Good fit, good seal, can listen more than 8h without discomfort. High-quality contact material like lambskin or velour
- Easily forget you’re using them, may as well be an implant
Value
Sometimes headphones aren’t amazing, but they satisfy a need extremely well. Not only so we identify the main target for every model of headphones we review, but we also weigh its value. That could mean how much you’re getting for how little money spent, or it offers a truly unique feature not seen anywhere else.
- Total ripoff, every dollar could have been better spent
- Works kinda, very bad buy though
- Almost works as advertised, not worth the money
- Works as advertised, not really worth the money
- Works as advertised, not amazing price but still worth it
- Works well, price could be better but worth it
- Works well, price is where it should be
- Works well, priced commensurate with top competitors
- Diamond in the rough, will outperform what you spend on it
- You will earn money by buying this thing
Features
Nowadays, it’s no longer enough to simply be good headphones, but most people want their personal audio products to do other things. For example, use playback controls, or have such luxuries as “a microphone” or interchangeable pads.
- Totally devoid of anything interesting, does one thing only
- Offers a couple things beyond “play sound” but of dubious merit
- Does less than what most other items in category do
- Does what most other items in category do, but badly
- Does what most other items in category do
- Does what most other items in category do, but well
- Has a feature or two that is uncommon to category (This doesn’t have to be just software, can be hardware too like a special inline module or a bajillion high-quality ear tips)
- Companion app (works, but has basic EQ, features)
- Good companion app (decent EQ, find my buds, fast switching, FW updates)
- Could bring a user into singularity if given enough time
Overall scores
After all is said and done, the site’s back end will then combine all the scores together and that will be the overall score. I caution everyone to put more effort into finding the individual scores that matter to you instead of relying on one overarching score, but we do attempt to contextualize a product in more ways than one in each review.
You might find that you don’t care so much about certain scores we track. That’s okay! Just be sure to keep tabs on the ones you care about, because we try to make very granular assessments to help people along their personal audio journey.